8D Reports statistics in the Reports module
The Reports module communicates with other TeamGuru modules. You can create a report document that gives you several statistics from the 8D Reports saved in the system.
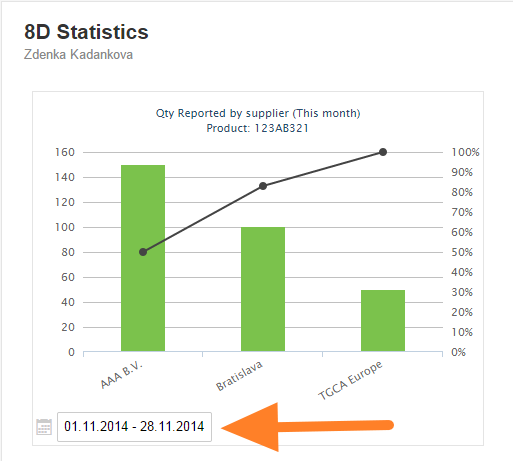
You can get various charts according to your specific needs - e.g. COPQ costs per supplier or per product, new 8D per time, quantity returned etc.
Data are taken directly from the TeamGuru database, so there is no need to enter anything manually in the report and the charts always display current values.
Follow the instructions below to create your own charts:
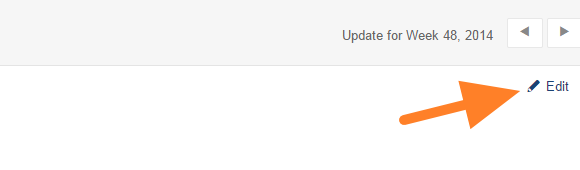
- Go to the edit mode of your report slide by clicking on the Edit icon
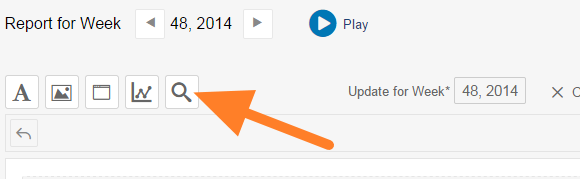
- Click on the Insert 8D statistics (magnifying glass) icon
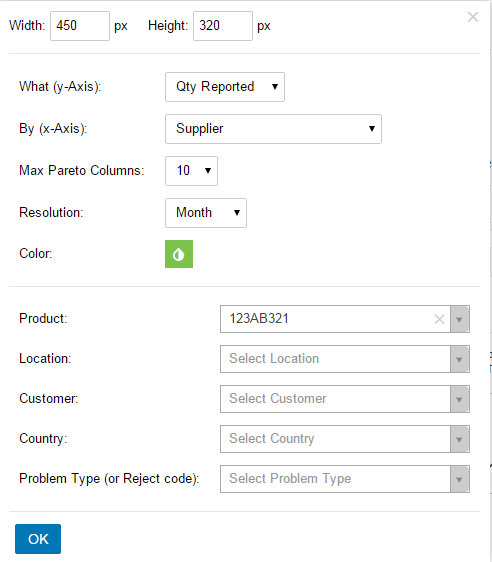
- Select criteria for your chart and click on OK
- The chart has been attached. You can change the period displayed according to your needs.