Metric Dashboard Statistics
View your metric dashboard statistics in a chart and customize it based on your preference.
You can also learn about our trend chart and metric dashboard charts view functionality.
Video Guide (text instructions below)
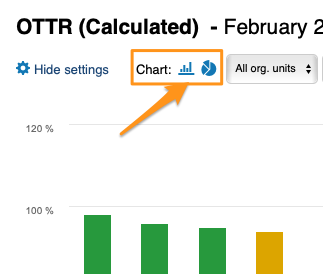
1. Click the column chart icon to view your dashboard statistics (images per different dashboard's view) 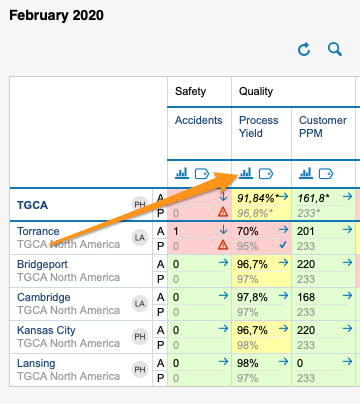
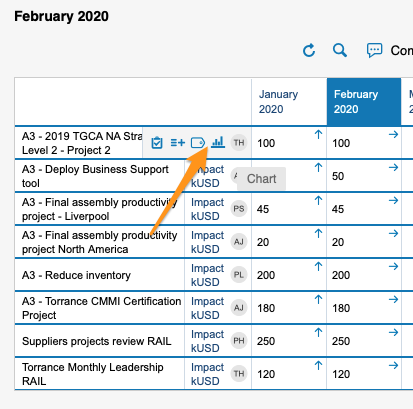
Please note: You can view statistics only if there is more than one org. unit, project or partner in your dashboard.
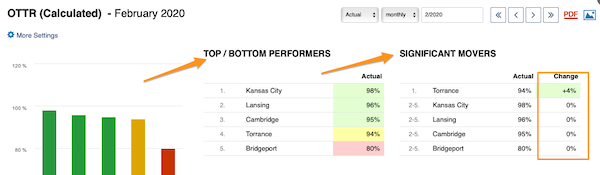
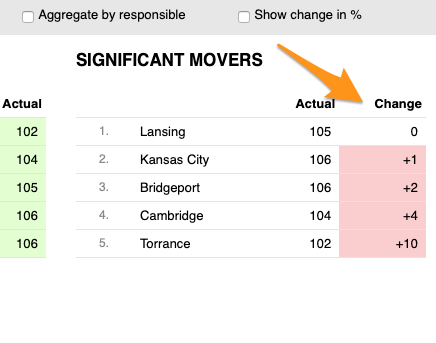
2. You will get the basic view where you can see your base (input) units, Top/Bottom performers (sorted from the best results down), and Significant Movers with an extra column for comparison data of performance with the last period.
3. Click 'More Settings' button in the left upper corner to customize your view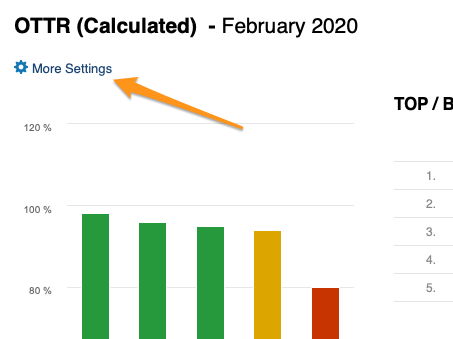
4. Make your selection:
a) Choose either bar or pie chart view
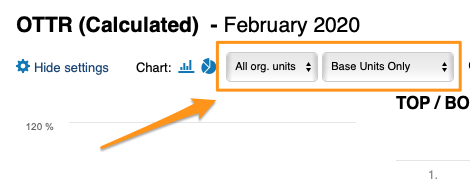
b) Select units that you would like to view in your chart
c) 'Compare to' - you can choose from the submenu how many periods (1-12) you would like to go back to get a comparison of performance with the current period under Significant movers.
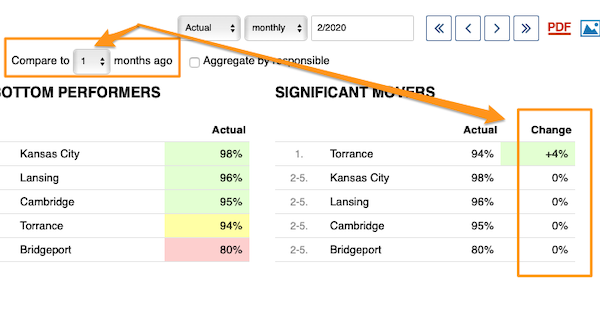
Your period is based on your selection.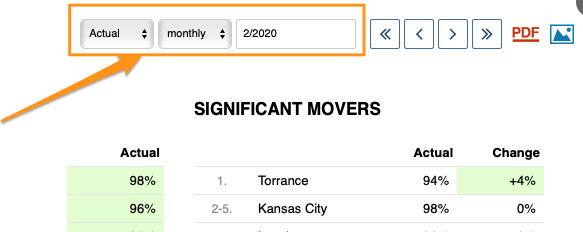
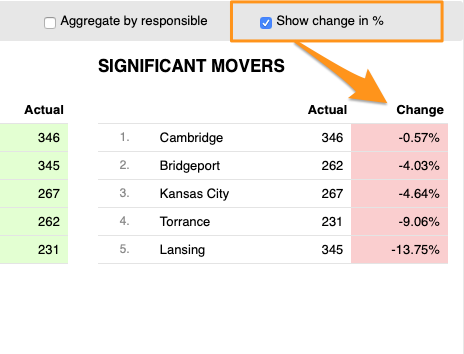
You can display change of performance comparison with other time period, either in absolute values or show it in percentage.
You can also Skip Weekends for the comparison data of your Significant movers.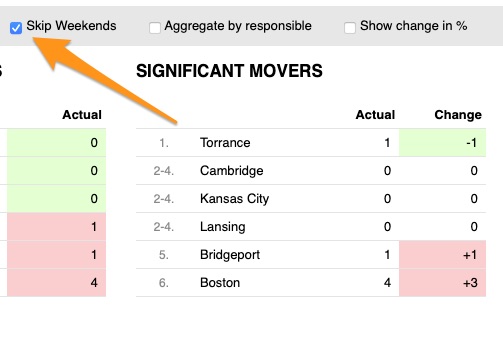
d) 'Aggregate by responsible' - you have an option to summarize data for all org. units or projects in the dashboard per responsible person.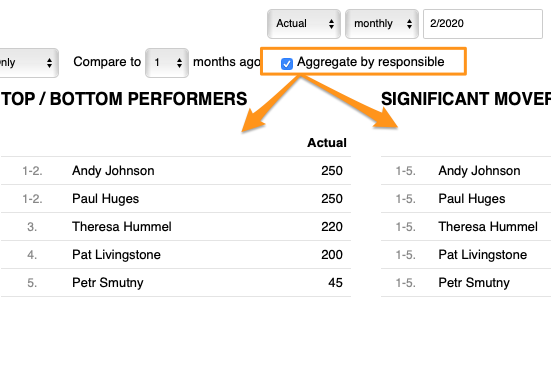
To Set Up Responsible in Metric Dashboard
Option 1 - Set up Responsible in automatic metric dashboards
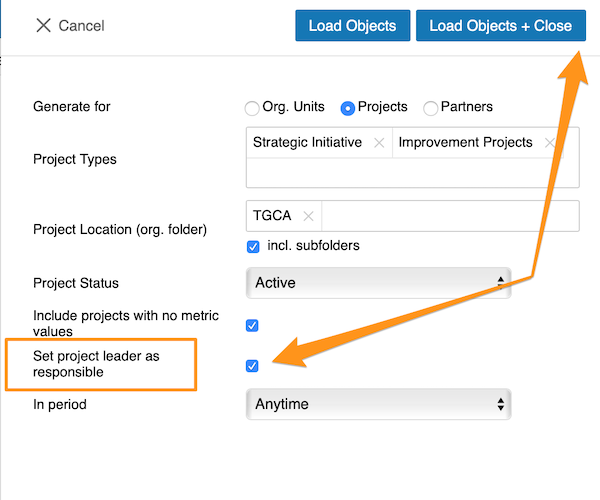
When you are using automatic metric dashboard, click Settings button on the bottom and then you can just tick the box for 'Set project leader as responsible' and Responsible will be added automatically to your dashboard.
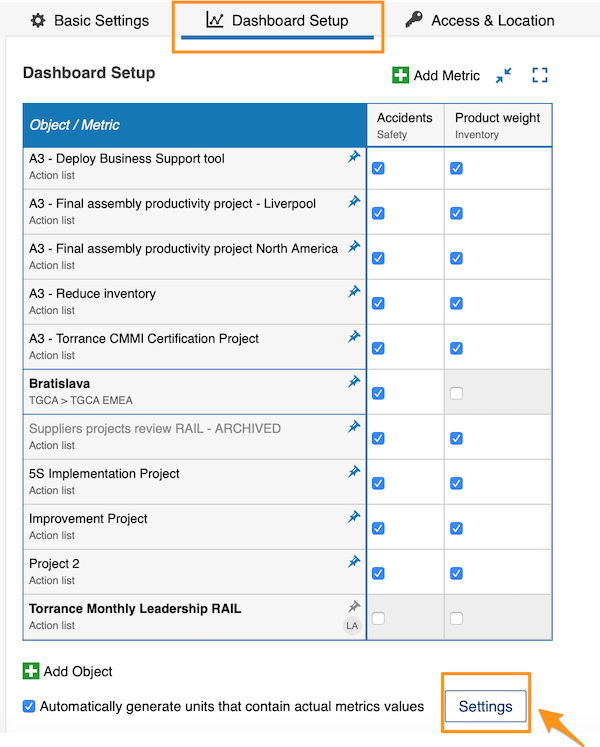
Option 2 - If you are not using automatic metric dashboard or you would like to choose your responsible manually. Go to your dashboard settings and Dashboard setup tab.
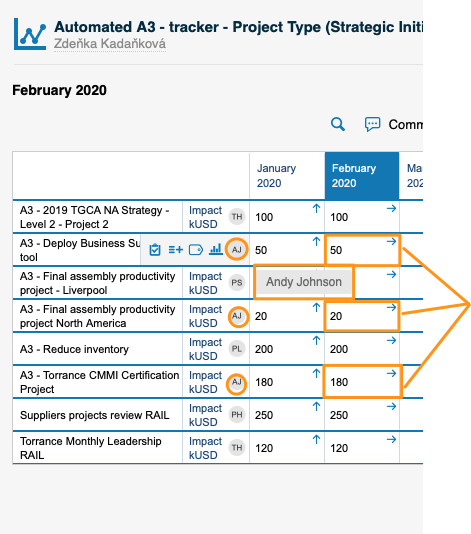
Then you can either select responsible for org. unit/metric combination (click into a cell, add your Responsible and Apply changes). 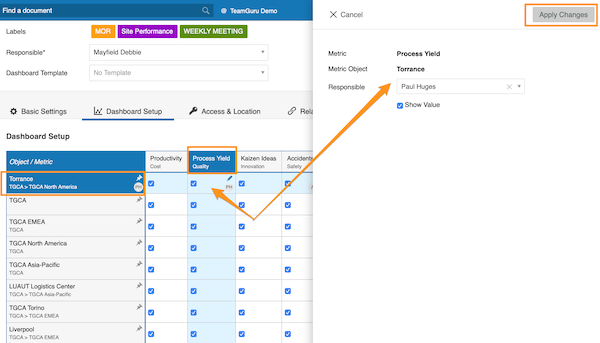
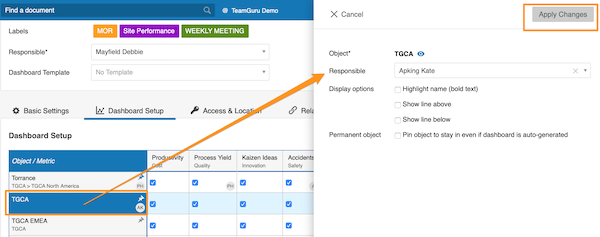
Or you can select responsible for the whole org. unit (click on org. unit, choose Responsible and Apply changes).
View Responsibles in Dashboard
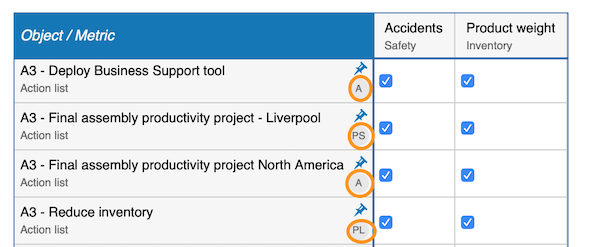
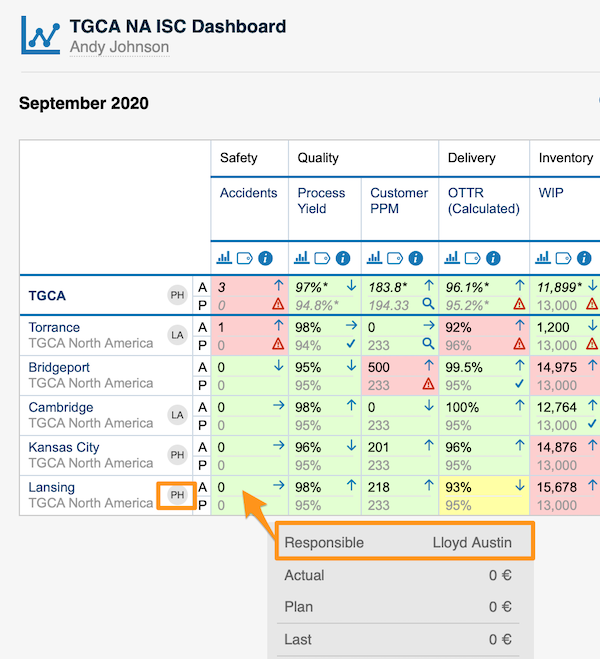
Responsible for org. unit/project - you will see responsible's initials right next to it and when you hover over initials, you will see the whole name.
Responsible for org. unit/metric combination - you will see it in a popup window along with other data when you hover over the cell.
Please note: You can assign only one Responsible per project.