Advanced (Beta) - Metric Dashboard Settings
Customize your metric's settings in the dashboard and add/display more columns/rows per your needs. This functionality helps you to:
- View calculated values without creating a new metric
- Display project header information for project dashboards
General info followed by examples
Go to your dashboard settings using edit pencil. 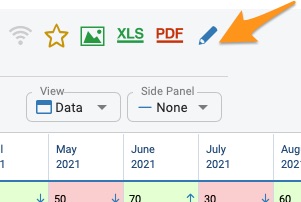 Then select a "Dashboard Setup" tab and click on the metric.
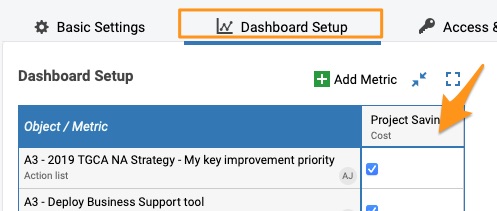
Here you will find three settings options in the submenu.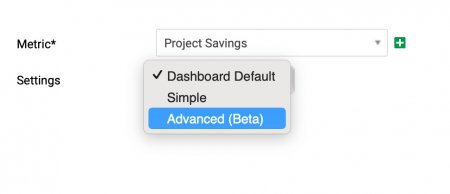
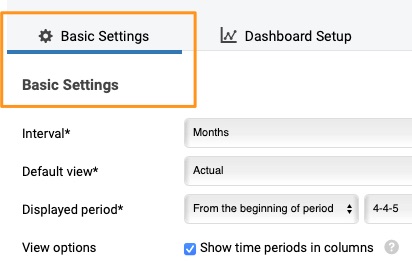
Dashboard Default is defined under the "Basic settings" tab. It is the same setup for all the metrics used in a dashboard unless the metric(s) are customized with simple or advanced options.
Simple is metric's settings when you can set up specified fields differently than in the basic settings (e.g. you can set up different triggers for RCCA alerts for a metric(s) of your choice, or other show to-date values, etc.).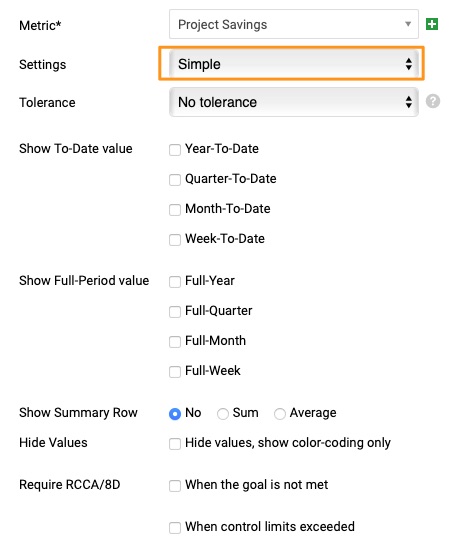
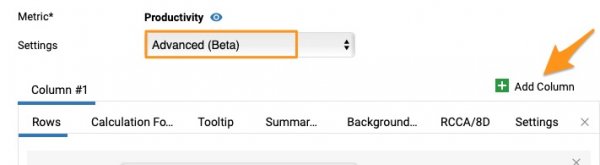
Advanced (Beta) enables you to add metric rows/columns per your preference (e.g., the status of your project, extra calculation, etc.).
Please note that if you set up Advanced (Beta) settings and then you change it to Simple or Default dashboard settings, all the advanced settings will be removed.
Example 1 - Calculated Values
Let's say that you would like to, for example, calculate the Actual vs Plan value and display it as a column.
- Go to your metric in the dashboard settings. Select Advance (Beta) settings and Add column by clicking the green plus button.
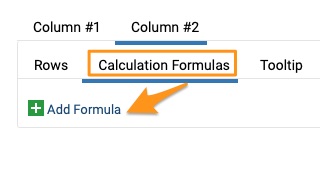
- Your Column #2 is created (please note that active column is underlined). Then go to the Calculation Formulas tab and Add formula
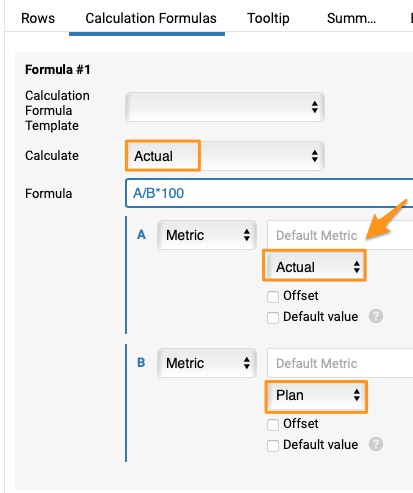
- You can select from preset formulas in the first field Calculation Formula Template or use your own formula in the Formula field. If you want to compare Actual values vs Plan or Forecast, you must choose in the Calculate field the option Actual. The formula will be automatically set up with a default metric, but you can change it if needed.
- Then go to the Rows tab and Add Row by clicking the green plus button.
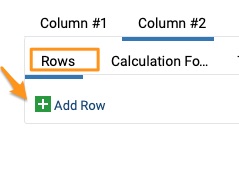
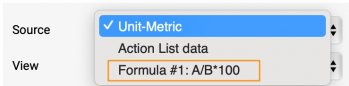
- Select your Formula from the Source submenu.
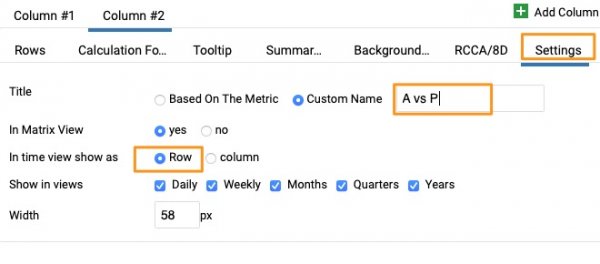
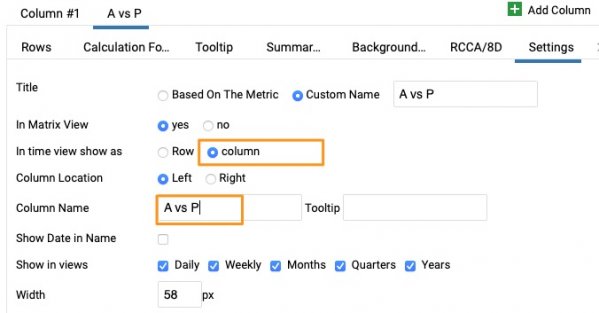
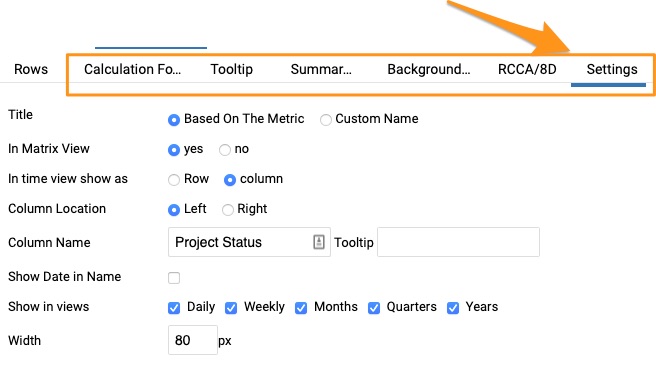
- Go to the Settings tab and define if you would like to see a row or column, add a Custom name, choose Show in views, Width, etc.
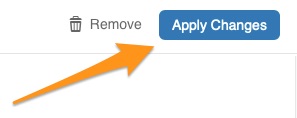
- Once ready, hit the Apply changes button and save dashboard settings.
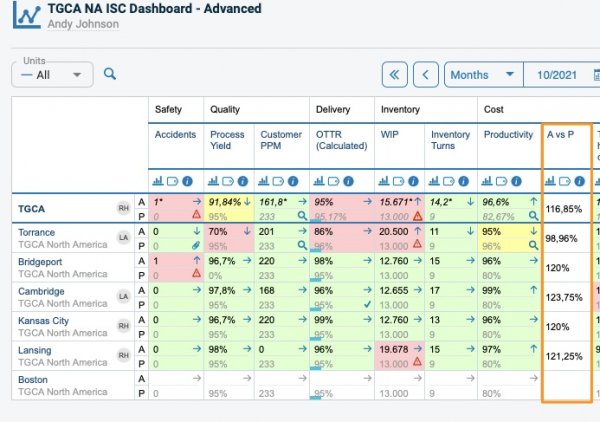
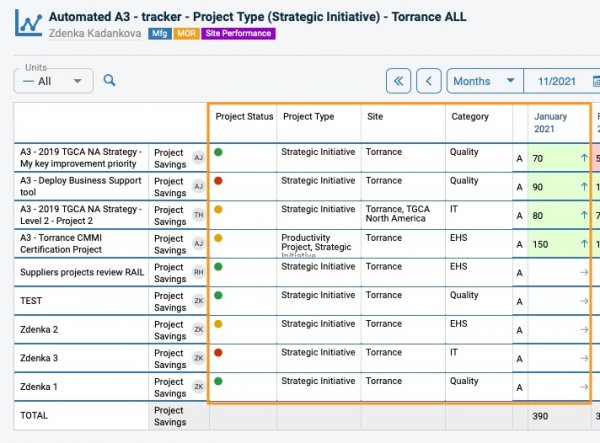
- In your dashboard where several units are included, it will be displayed like this.
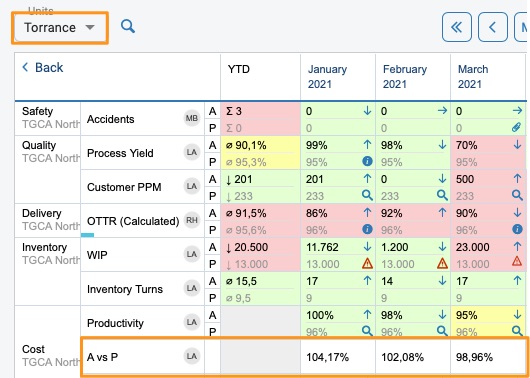
- When you click on a specific site, it will be displayed like this when set up as a row.
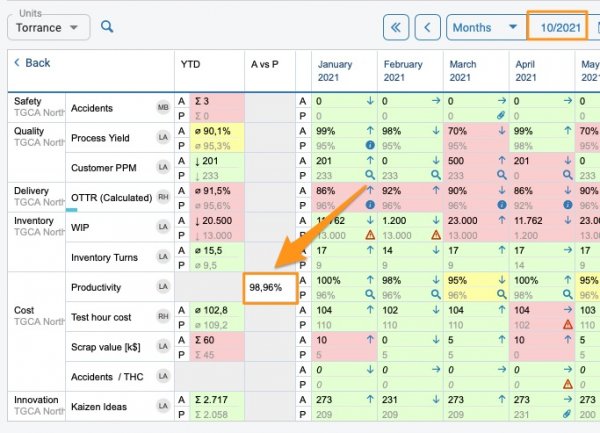
- If you choose column view in the settings, it will be displayed like this. You will have to customize a different name for your column.
Example 2 - Display project header information
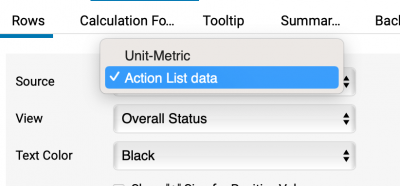
Please follow the same process as above. Add columns and set up each Column with Row(s) that you need. Then select Action List Data as the Source. In the field, View, choose what info you would like to see from your project (e.g. Overall Status), and customize your name in the settings. 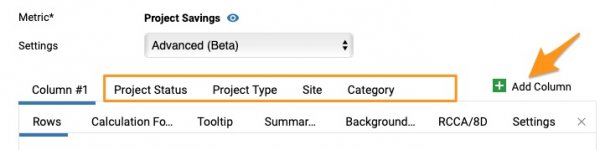
There are other tabs that you can define if needed - Tooltip, Summary Row, Background Color, RCCA/8D, and Settings.
Please contact us if you need any assistance setting up your dashboard.