How to display a graph for an individual object (org. unit, partner, etc.)
When you use a summary dashboard and you need to display graphs for a particular object only, follow the next steps:
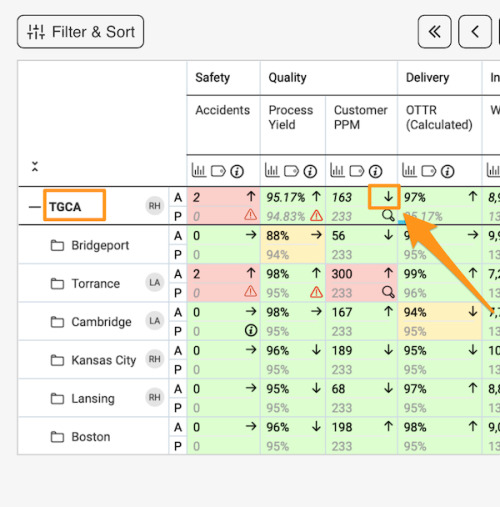
- Go to your dashboard
- Click on the little arrow next to a metric value
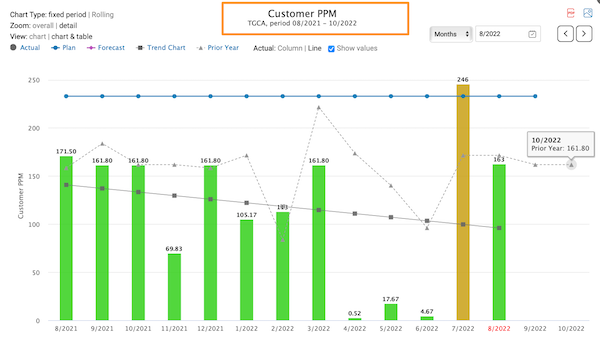
- View the graph
Related articles - How to display and print individual dashboards of a supplier / org. unit from the main dashboard?