Project metrics in Report
You can show summarized project metric data for a group of projects in your report.
- Go to a slide and use the Click to edit icon on the top right corner.

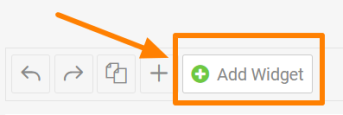
2. Click on the green plus button to Add Widget and select Chart from the submenu

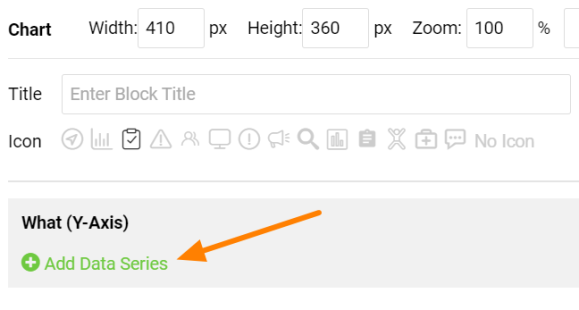
3. Use the green plus Add Data Series icon to be able to define your chart.
4. Select Project Metrics in the Data Source and choose the Metric that you need to display in your chart. Choose the selection criteria in the Project Selection part.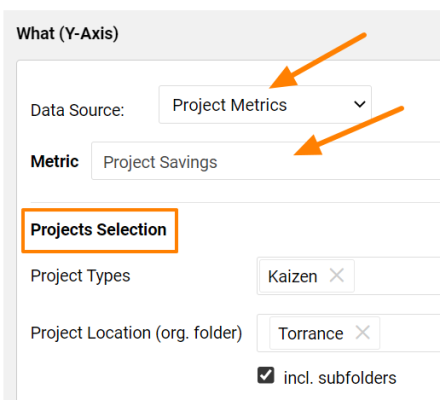
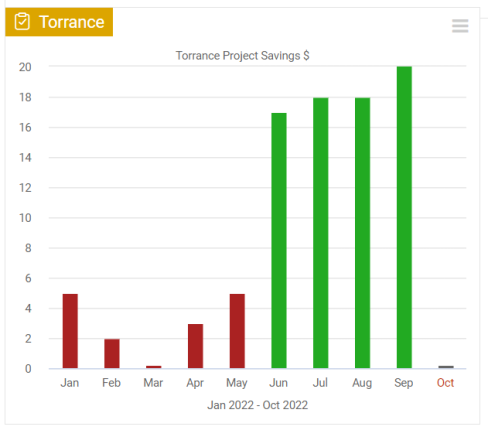
View your project metric in the chart.