RCCA statistics in Reports Module - Chart widgets
Connect your RCCA documents with our Reports module, where you can create different types of statistics.
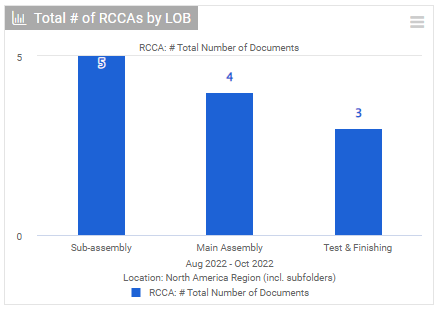
Monitor the number of your total, new, open, and closed documents. Keep track of your RCCA documents by problem type, location, severity, and more.
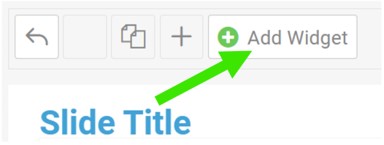
In your Report, click on to Add widget.
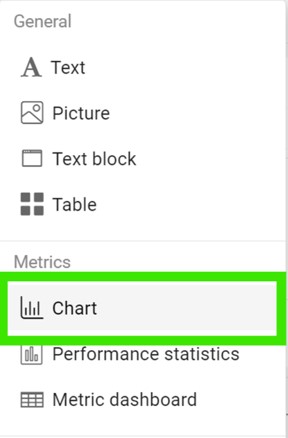
Select Chart from the submenu.
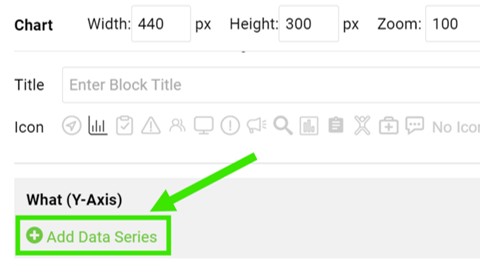
Add Data Series.
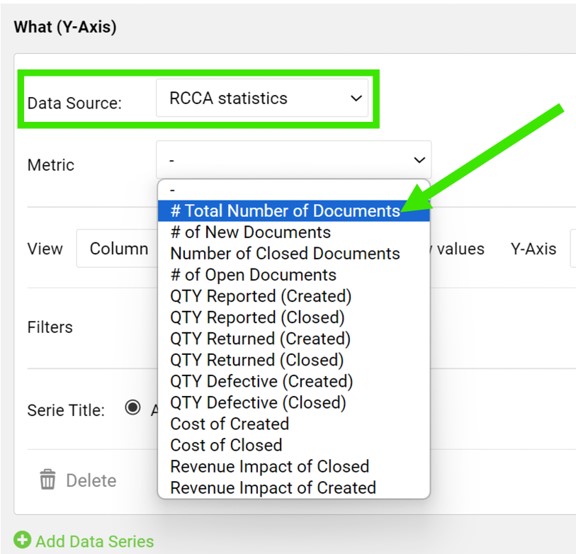
Select RCCA Statistics (Data Source) and your Metric.
Define Categories, a time period, and other settings. 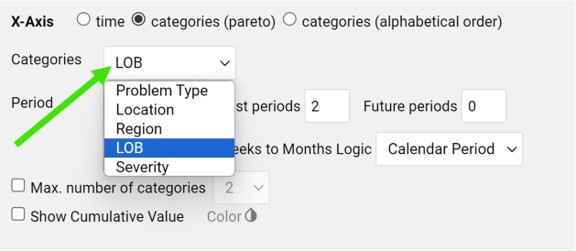
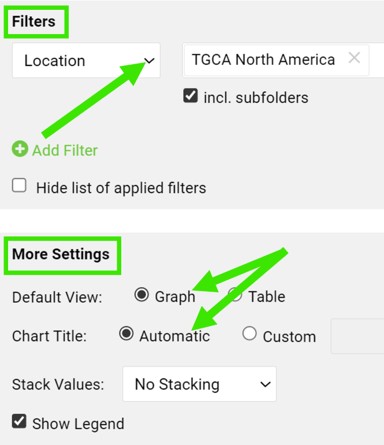
You can also set up additional Filters (e.g., Location, Metric, RCCA Template, etc.) and the View/title/legend in the More Settings section.
View your charts.
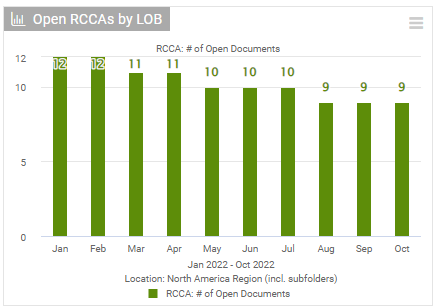
You can also view RCCA documents' development through a specific time period.
Please follow this link to learn more about how to set up your Reports.