如何在图表中仅显示工作日数据
本文由英文机器翻译。 当前显示英文原文。
If you collect data daily, you can display them in your charts for weekdays only, without weekends.
-
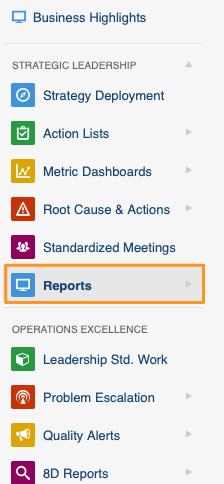
Open your report. Go to the Reports module and open your document.
-
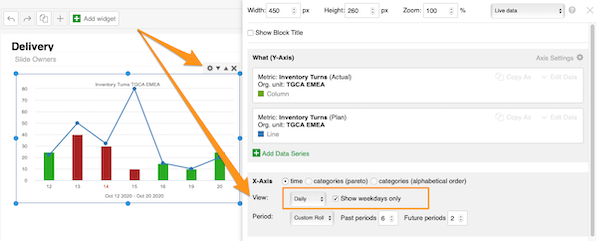
Turn on weekdays only. Click your Charts widget and the settings gear icon in its upper right corner. Select daily values for View and tick the Weekdays only box.
Check the chart
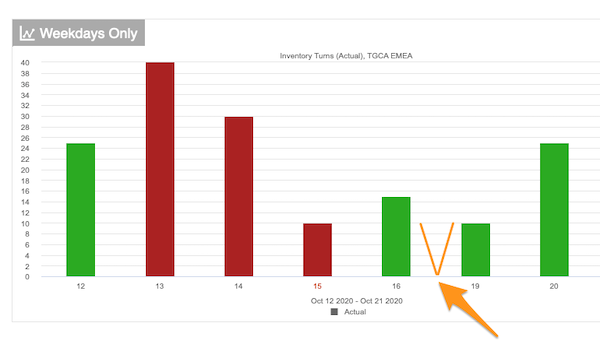
Your chart now shows weekday data only.
如果您每天收集数据,可以在图表中只显示工作日的数据,不显示周末。
-
打开报告。 进入报告模块,打开您的文档。
-
开启仅显示工作日。 点击图表组件,再点击其右上角的设置齿轮图标。在视图中选择每日值,并勾选仅工作日复选框。
检查图表
现在,图表只显示工作日的数据。
还需要帮助吗?
请给我们留言。工作日我们通常会在一小时内回复。