New Dashboard Settings
We have recently upgraded our Metric Dashboard Settings.
You are now able to track and report data not only on the Organization units, Projects, Partners, and Object Group, but it's also possible to choose Users, Actions, Products, and Product families.
These newly added data collection objects can be also pre-set in the Object Group (so it's easy to upload the same group of objects into several metric dashboards). Please see below for the details.
Video guide (text instructions included below)
Our Metric Dashboards edit mode has been re-organized into these tabs - Basic Settings, Dashboard Setup, Access & Location, Related Documents, Subscriptions, Notifications, and History.

Under the first tab, you will find all the Basic Settings such as Interval, View options, Row Layout, etc.
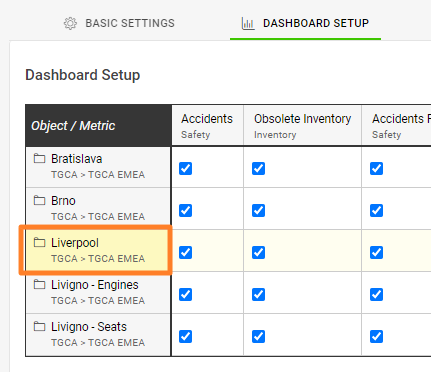
Dashboard Setup Tab - you will find data collection objects + metrics in the matrix view. All the details are described at the bottom of this article as the main enhancement has been done here.
Access & Location - here you can lock the data for the public (means for all system users who have the access to all documents and data in the specific org. structure unit) and keep it accessible only for invited (specific TG users). It's also possible to enable Protect Settings Function (and select only those system users who can edit the dashboard's settings). To share the dashboard with an external partner - use the External Sharing field and select the particular partner. An important part of each metric dashboard is Document Location - on which the org. structure the dashboard will be located.
Related Documents - you can link related documents for easy navigation
Subscription - to send the dashboard out to the mailbox in the pre-defined time schedule
Notification - you can set up Data Entry Reminder, Send an Overdue Notification, or Send RCCA Reminder here.
History - to view the history log of the dashboard settings changes
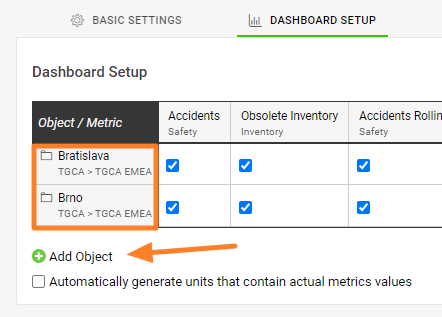
Dashboard Setup
To set up data collection objects
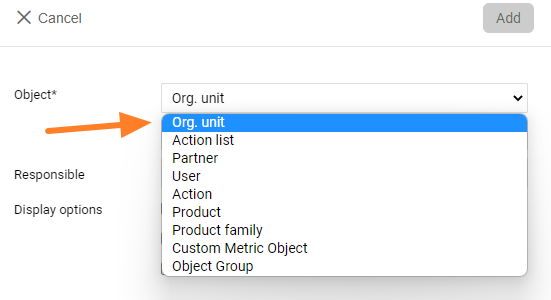
Click Add object - you can now select specific objects or their combinations (objects = Org. units, Action lists, Partners, Users, Actions, Products, Product families), or a pre-defined group of objects by using Object group.
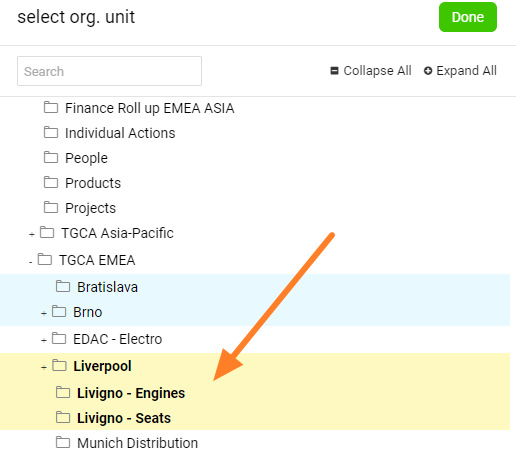
It's now also possible to multi-select org. units from the structure. Just click on your org. structure and select as many units as you need in one step.
Data collection objects can be:
Multi-select org. unit - choose by clicking all units that you need to select
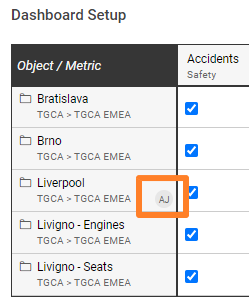
You can add a Responsible person (from the list of users) either to all of the selected org. units on the dashboard (when selected the org. units)
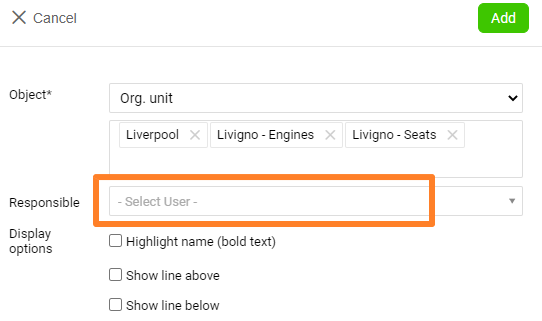
or to each org. units specifically - by clicking on the org. unit
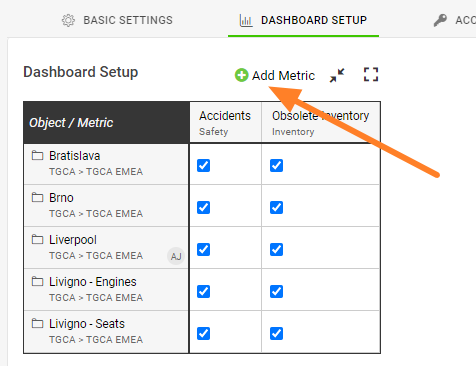
To set up metrics:
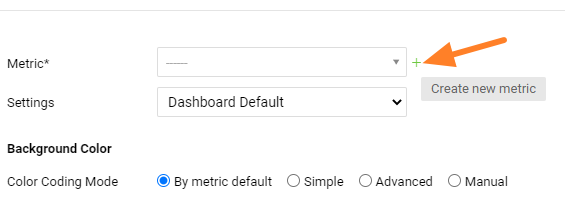
Click Add metric, select from existing metrics, and choose the other settings.
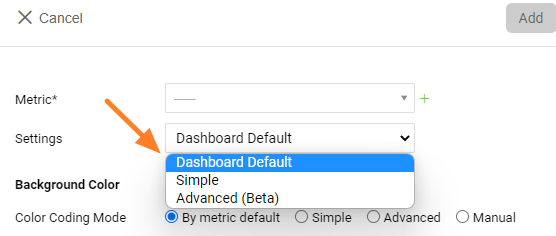
Settings:
- Dashboard Default - will implement all the settings that are in the Basic settings of the dashboard
- Simple - provides some Basic options such as Show To-date or Full-Period values, Show summary row, Hide values (display icon of red, yellow, green smile) etc.
- Advanced (Beta) - provides Advanced settings, advanced columns, raw and calculations from an original metric
You can also create completely new metrics directly from your dashboard.
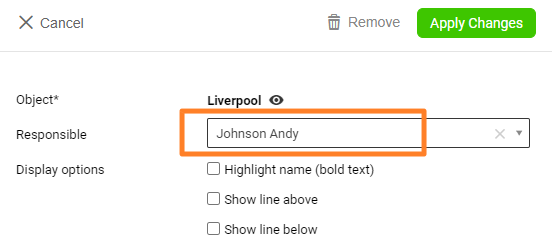
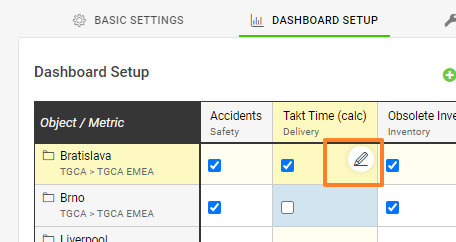
You can add a Responsible person for a combination of org. unit/metric by clicking on the edit pencil in the intersection of org. unit/metric
To move org. unit or metric, simply use the drag and drop function.
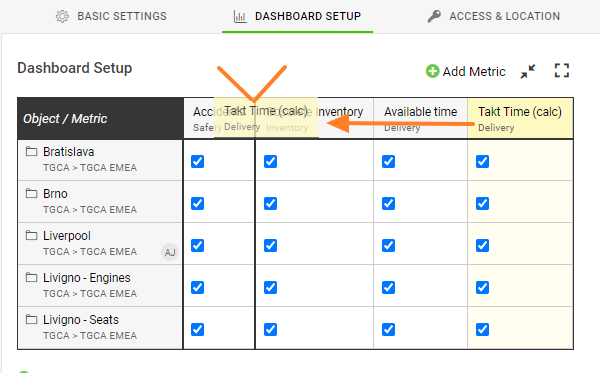
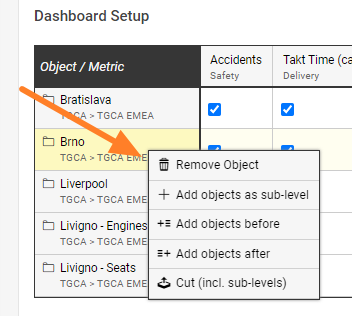
You can also right-click either on your org. unit or metric, and you can remove your metric, and add or copy it to a specific place in your dashboard.
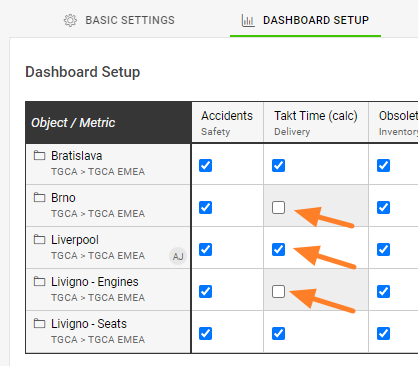
To select which metrics you want to display in a dashboard, check (activate) or uncheck (deactivate) the combination of the org. unit & metric.
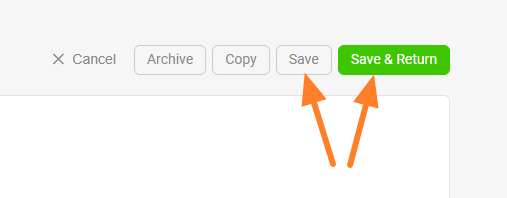
And please, don't forget to Save your settings.
Related articles - Custom Objects and Summary metrics