Statystyki raportów 8D w module Raporty
Tłumaczenie maszynowe z angielskiego. Wyświetlany jest oryginał po angielsku.
The Reports module works together with the other TeamGuru modules. You can create a report that shows various statistics from the 8D Reports saved in the system.
Create the charts you need, e.g. COPQ costs per supplier or per product, new 8D reports over time or quantities returned. The data are taken directly from the TeamGuru database, so you don’t need to enter anything manually in the report and the charts always show current values.
-
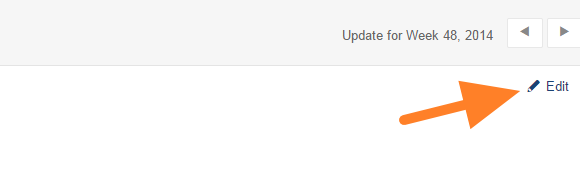
Open the slide in edit mode. Click the Edit icon on your report slide.
-
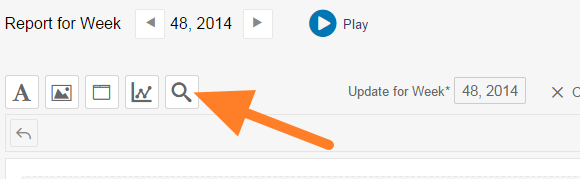
Insert the 8D statistics. Click the Insert 8D Statistics icon (magnifying glass).
-
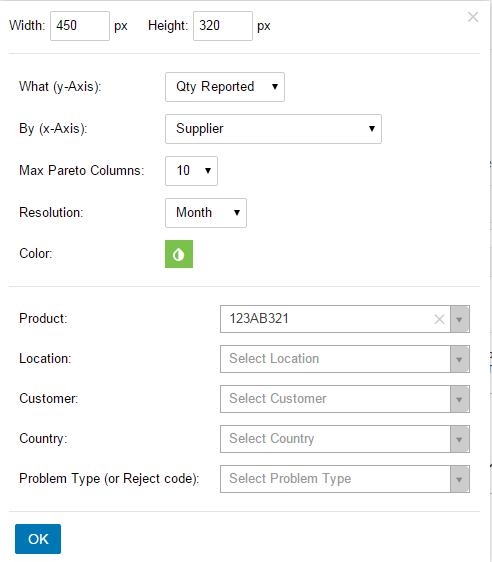
Select the chart criteria. Select the criteria for your chart and click OK.
-
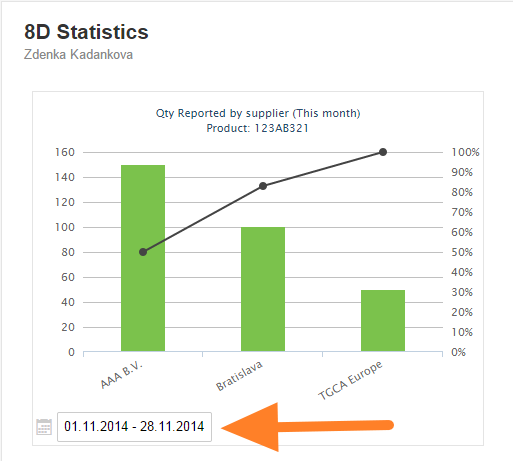
Adjust the displayed period. The chart is now attached to the slide. You can change the displayed period as needed.
Moduł Raporty współpracuje z pozostałymi modułami TeamGuru. Możesz utworzyć raport z różnymi statystykami raportów 8D zapisanych w systemie.
Utwórz potrzebne wykresy, np. koszty COPQ według dostawcy lub produktu, liczbę nowych raportów 8D w czasie albo ilości zwrócone. Dane pochodzą prosto z bazy danych TeamGuru, więc nie musisz niczego wpisywać ręcznie, a wykresy zawsze pokazują aktualne wartości.
-
Włącz tryb edycji slajdu. Kliknij ikonę Edytuj na slajdzie raportu.
-
Wstaw statystyki 8D. Kliknij ikonę Wstaw statystyki 8D (lupa).
-
Wybierz kryteria wykresu. Wybierz kryteria wykresu i kliknij OK.
-
Dostosuj wyświetlany okres. Wykres jest już na slajdzie. W razie potrzeby zmień wyświetlany okres.
Potrzebujesz dalszej pomocy?
Napisz do nas. W dni robocze zwykle odpowiadamy w ciągu godziny.