Statistiky 8D reportů v modulu Reporty
Strojový překlad z angličtiny. Zobrazen anglický originál.
The Reports module works together with the other TeamGuru modules. You can create a report that shows various statistics from the 8D Reports saved in the system.
Create the charts you need, e.g. COPQ costs per supplier or per product, new 8D reports over time or quantities returned. The data are taken directly from the TeamGuru database, so you don’t need to enter anything manually in the report and the charts always show current values.
-
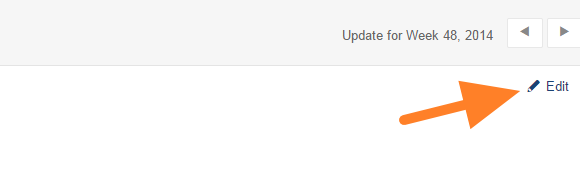
Open the slide in edit mode. Click the Edit icon on your report slide.
-
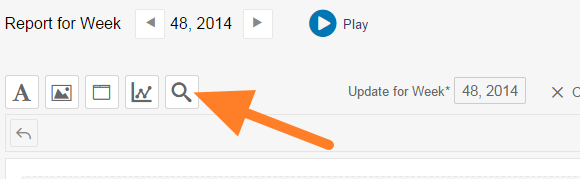
Insert the 8D statistics. Click the Insert 8D Statistics icon (magnifying glass).
-
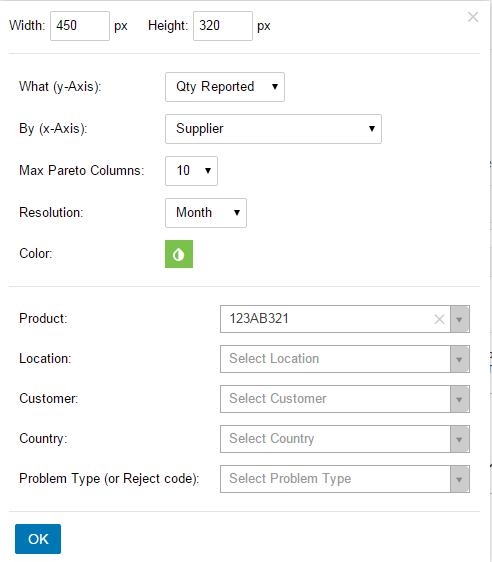
Select the chart criteria. Select the criteria for your chart and click OK.
-
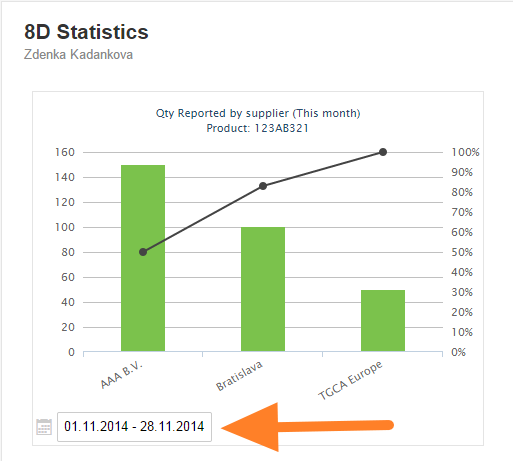
Adjust the displayed period. The chart is now attached to the slide. You can change the displayed period as needed.
Modul Reporty je propojený s ostatními moduly TeamGuru. Můžete vytvořit report s různými statistikami z 8D reportů uložených v systému.
Vytvořte grafy, které potřebujete, např. náklady COPQ podle dodavatele nebo produktu, nové 8D reporty v čase nebo vrácená množství. Data se berou přímo z databáze TeamGuru, takže do reportu nemusíte nic zadávat ručně a grafy vždy ukazují aktuální hodnoty.
-
Otevřete snímek pro úpravy. Na snímku reportu klikněte na ikonu Upravit.
-
Vložte statistiky 8D. Klikněte na ikonu Vložit statistiky 8D (lupa).
-
Zvolte kritéria grafu. Vyberte kritéria grafu a klikněte na OK.
-
Upravte zobrazené období. Graf je teď vložený do snímku. Zobrazené období můžete podle potřeby změnit.
Potřebujete další pomoc?
Napište nám. V pracovní dny obvykle odpovídáme do hodiny.