Project metrics in Report
You can show summarized project metric data for a group of projects in your report.
-
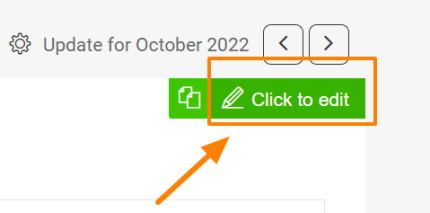
Open the slide in edit mode. Go to a slide and click the Click to edit icon in the upper right corner.
-
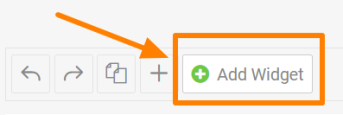
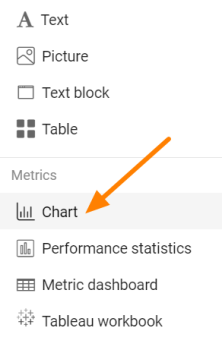
Add a Chart widget. Click the green plus button Add Widget and select Chart from the submenu.
-
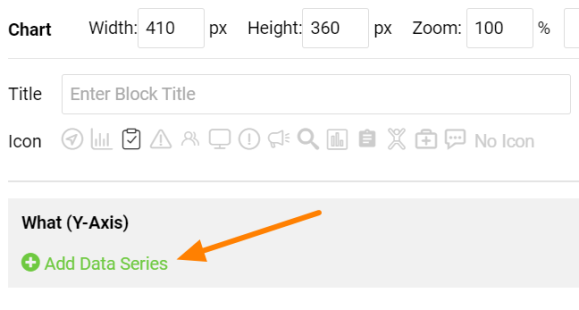
Add a data series. Click the green plus Add Data Series icon to define your chart.
-
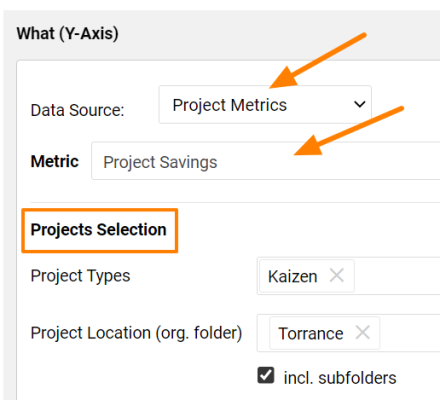
Select the project metric. Select Project Metrics as the Data Source and choose the Metric you want to display in your chart. Choose the selection criteria in the Project Selection part.
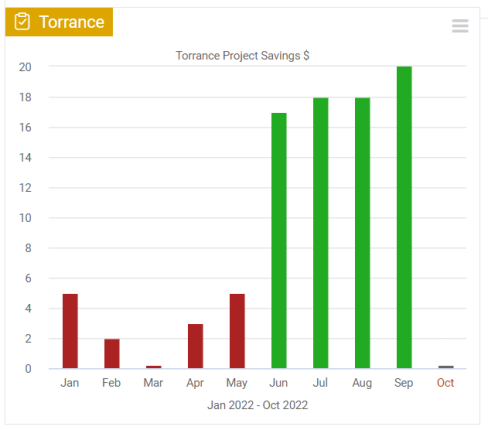
View the chart
Your project metric is now displayed in the chart.
Still need help?
Write to us. We usually reply within an hour on business days.