Projektové metriky v reporte
Strojový preklad z angličtiny. Zobrazený je anglický originál.
You can show summarized project metric data for a group of projects in your report.
-
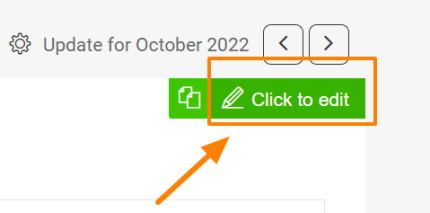
Open the slide in edit mode. Go to a slide and click the Click to edit icon in the upper right corner.
-
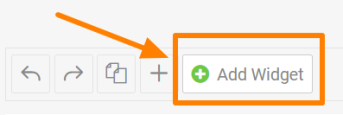
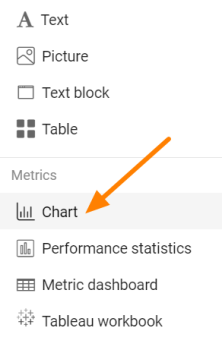
Add a Chart widget. Click the green plus button Add Widget and select Chart from the submenu.
-
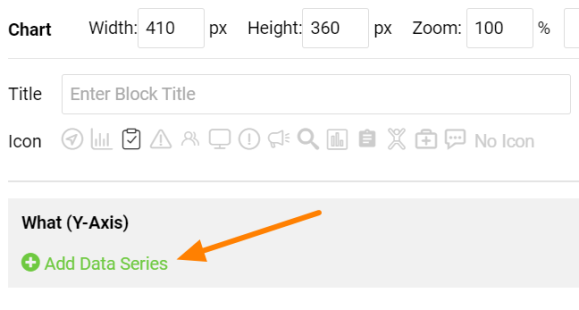
Add a data series. Click the green plus Add Data Series icon to define your chart.
-
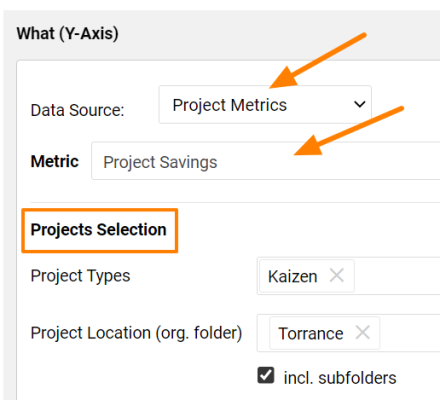
Select the project metric. Select Project Metrics as the Data Source and choose the Metric you want to display in your chart. Choose the selection criteria in the Project Selection part.
View the chart
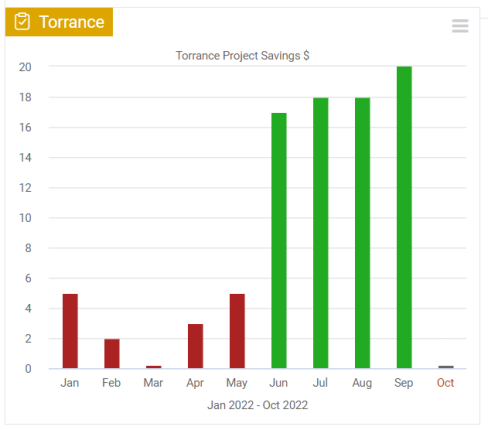
Your project metric is now displayed in the chart.
V reporte môžete zobraziť súhrnné údaje projektových metrík za skupinu projektov.
-
Otvorte snímku v režime úprav. Prejdite na snímku a kliknite na ikonu Kliknutím upravte v pravom hornom rohu.
-
Pridajte widget Graf. Kliknite na zelené tlačidlo s plusom Pridať widget a v podmenu vyberte Graf.
-
Pridajte dátový rad. Graf nadefinujete kliknutím na zelenú ikonu s plusom Pridať dátový rad.
-
Vyberte projektovú metriku. Ako Zdroj dát vyberte Projektové metriky a zvoľte Metriku, ktorú chcete v grafe zobraziť. V časti Výber projektov nastavte kritériá výberu.
Pozrite si graf
Graf teraz zobrazuje vašu projektovú metriku.
Potrebujete ďalšiu pomoc?
Napíšte nám. V pracovné dni zvyčajne odpovedáme do hodiny.