在报告中显示项目指标
本文由英文机器翻译。 当前显示英文原文。
You can show summarized project metric data for a group of projects in your report.
-
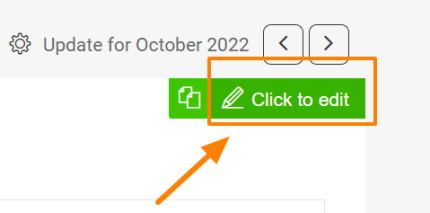
Open the slide in edit mode. Go to a slide and click the Click to edit icon in the upper right corner.
-
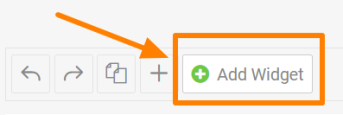
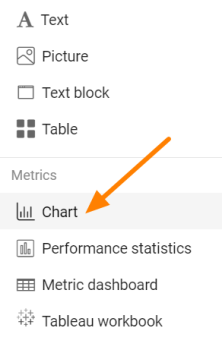
Add a Chart widget. Click the green plus button Add Widget and select Chart from the submenu.
-
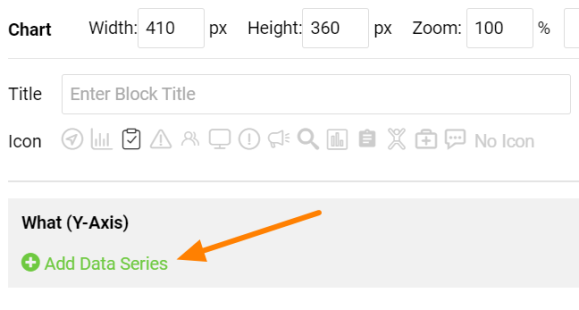
Add a data series. Click the green plus Add Data Series icon to define your chart.
-
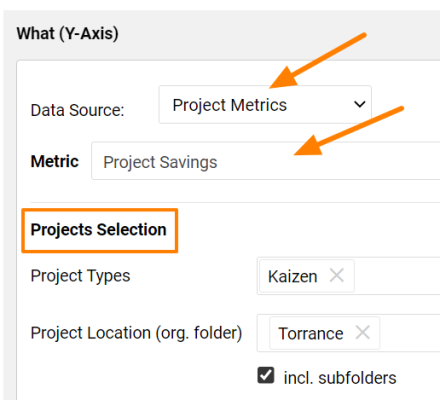
Select the project metric. Select Project Metrics as the Data Source and choose the Metric you want to display in your chart. Choose the selection criteria in the Project Selection part.
View the chart
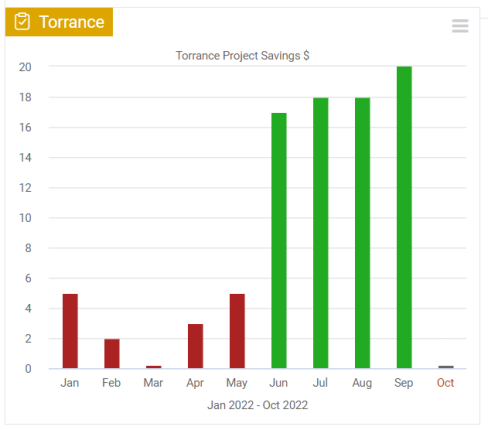
Your project metric is now displayed in the chart.
您可以在报告中显示一组项目的项目指标汇总数据。
-
以编辑模式打开幻灯片。 进入幻灯片,点击右上角的点击编辑图标。
-
添加图表组件。 点击绿色加号按钮添加组件,在子菜单中选择图表。
-
添加数据系列。 点击绿色加号添加数据系列图标来定义图表。
-
选择项目指标。 将数据源设为项目指标,并选择要在图表中显示的指标。在项目选择部分选择筛选条件。
查看图表
图表中现已显示您的项目指标。
还需要帮助吗?
请给我们留言。工作日我们通常会在一小时内回复。