Quality Alerts statistics in the Reports module
The Reports module works together with the other TeamGuru modules. You can create a report that shows various statistics from the Quality Alerts in the system.
Create the charts you need, e.g. COPQ costs per supplier or per product, new Quality Alerts over time or quantities returned. The data are taken directly from the TeamGuru database, so you don’t need to enter anything manually in the report and the charts always show current values.
-
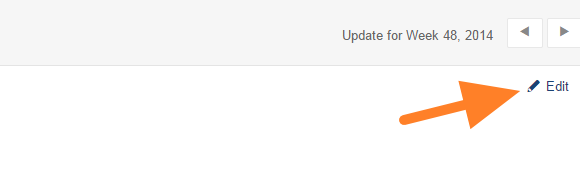
Open the slide in edit mode. Click the Edit icon on your report slide.
-
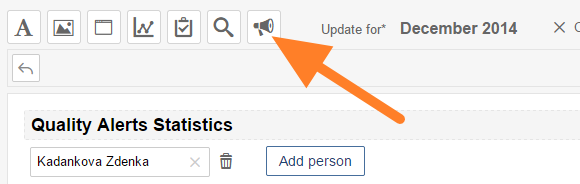
Insert the Quality Alert statistics. Click the Insert Quality Alert Statistics icon (loudspeaker).
-
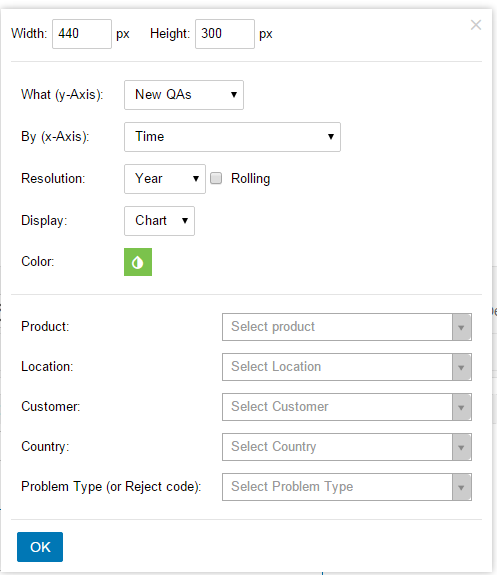
Select the chart criteria. Select the criteria for your chart and click OK.
-
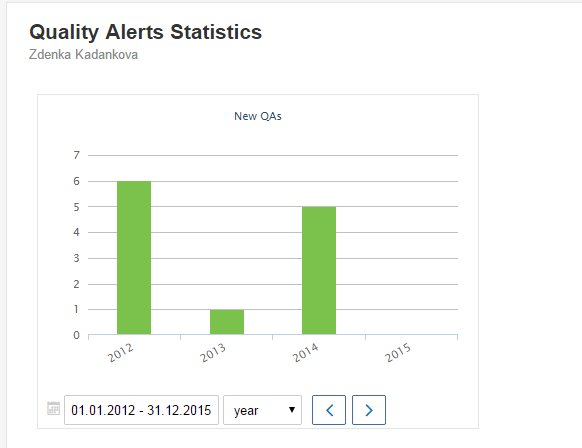
Adjust the displayed period. The chart is now attached to the slide. You can change the displayed period as needed.
Still need help?
Write to us. We usually reply within an hour on business days.