报告模块中的质量警报统计
本文由英文机器翻译。 当前显示英文原文。
The Reports module works together with the other TeamGuru modules. You can create a report that shows various statistics from the Quality Alerts in the system.
Create the charts you need, e.g. COPQ costs per supplier or per product, new Quality Alerts over time or quantities returned. The data are taken directly from the TeamGuru database, so you don’t need to enter anything manually in the report and the charts always show current values.
-
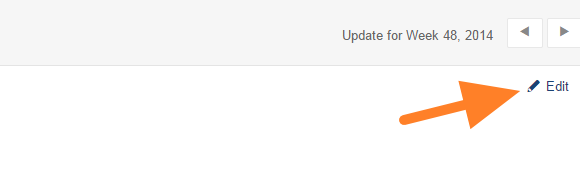
Open the slide in edit mode. Click the Edit icon on your report slide.
-
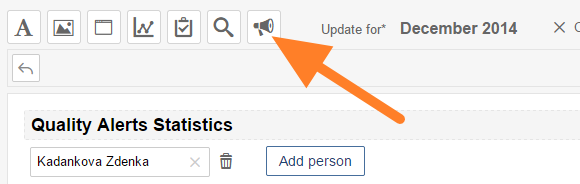
Insert the Quality Alert statistics. Click the Insert Quality Alert Statistics icon (loudspeaker).
-
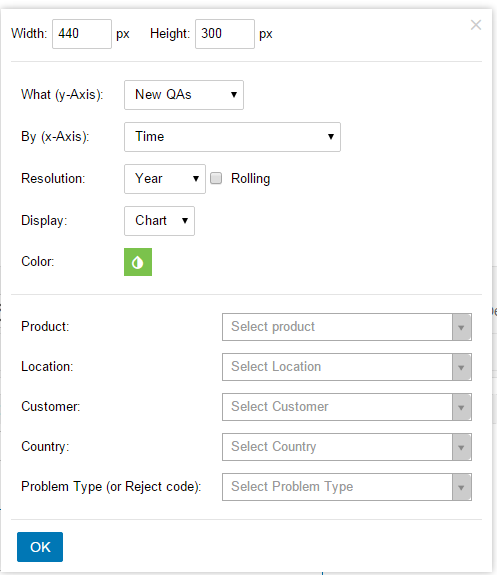
Select the chart criteria. Select the criteria for your chart and click OK.
-
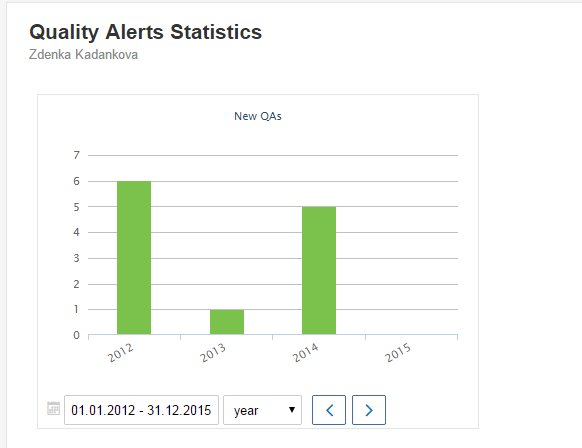
Adjust the displayed period. The chart is now attached to the slide. You can change the displayed period as needed.
在TeamGuru中,报告 模块与其他模块协同工作。您可以创建报告,显示系统中质量警报的各类统计数据。
按需创建图表,例如按供应商或产品统计的COPQ成本、随时间新增的质量警报或退货数量。数据直接取自TeamGuru数据库,因此无需在报告中手动输入任何内容,图表始终显示最新数值。
-
进入幻灯片编辑模式。 点击报告幻灯片上的 编辑 图标。
-
插入质量警报统计。 点击 插入质量警报统计 图标(扬声器)。
-
选择图表条件。 选择图表的条件,然后点击 确定。
-
调整显示周期。 图表现已添加到幻灯片中。您可以根据需要更改显示的周期。
还需要帮助吗?
请给我们留言。工作日我们通常会在一小时内回复。