Štatistiky alertov kvality v module Reporty
Strojový preklad z angličtiny. Zobrazený je anglický originál.
The Reports module works together with the other TeamGuru modules. You can create a report that shows various statistics from the Quality Alerts in the system.
Create the charts you need, e.g. COPQ costs per supplier or per product, new Quality Alerts over time or quantities returned. The data are taken directly from the TeamGuru database, so you don’t need to enter anything manually in the report and the charts always show current values.
-
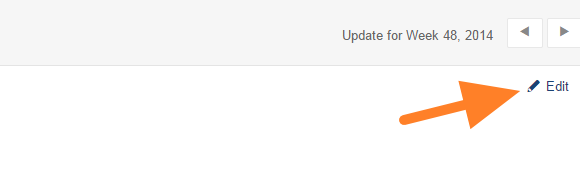
Open the slide in edit mode. Click the Edit icon on your report slide.
-
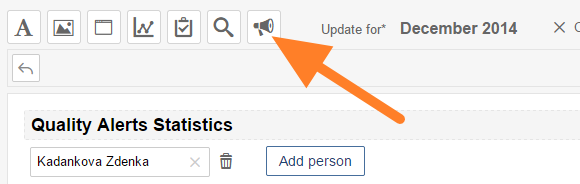
Insert the Quality Alert statistics. Click the Insert Quality Alert Statistics icon (loudspeaker).
-
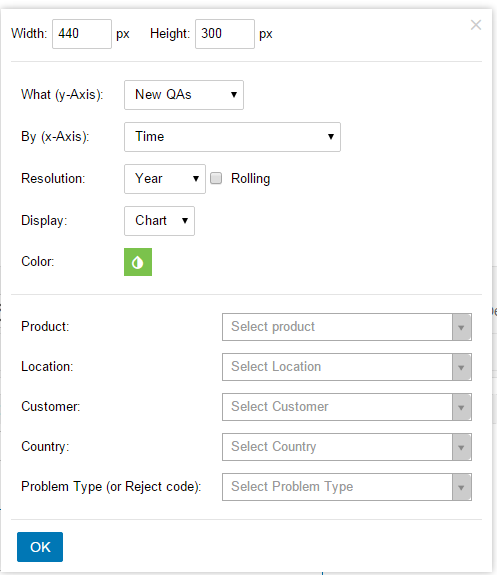
Select the chart criteria. Select the criteria for your chart and click OK.
-
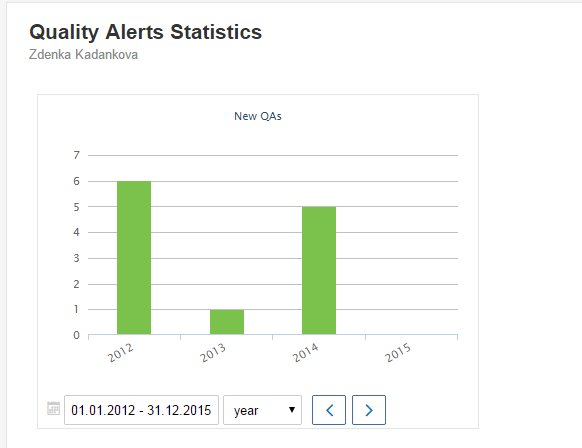
Adjust the displayed period. The chart is now attached to the slide. You can change the displayed period as needed.
Modul Reporty spolupracuje s ostatnými modulmi TeamGuru. Môžete vytvoriť report, ktorý ukazuje rôzne štatistiky z alertov kvality v systéme.
Vytvorte si grafy, ktoré potrebujete, napríklad náklady COPQ podľa dodávateľa alebo výrobku, nové alerty kvality v čase alebo vrátené množstvá. Údaje sa berú priamo z databázy TeamGuru, takže do reportu nemusíte nič zadávať ručne a grafy vždy ukazujú aktuálne hodnoty.
-
Otvorte snímku na úpravu. Na snímke reportu kliknite na ikonu Upraviť.
-
Vložte štatistiky alertov kvality. Kliknite na ikonu Vložiť štatistiky alertov kvality (reproduktor).
-
Zvoľte kritériá grafu. Vyberte kritériá grafu a kliknite na OK.
-
Upravte zobrazené obdobie. Graf je teraz vložený do snímky. Zobrazené obdobie môžete podľa potreby zmeniť.
Potrebujete ďalšiu pomoc?
Napíšte nám. V pracovné dni zvyčajne odpovedáme do hodiny.