如何创建矩阵格式的指标仪表板
本文由英文机器翻译。 当前显示英文原文。
The matrix format is great for tracking the same metrics across multiple org. units.
-
Open the dashboard settings. Click the Edit icon of your metric dashboard.

-
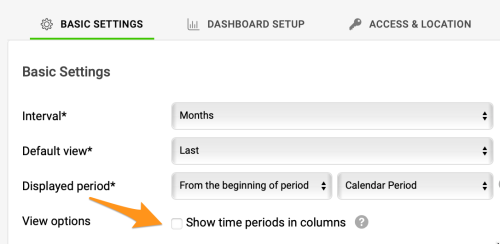
Keep time periods in rows. Leave the Show time periods in columns checkbox unchecked.
-
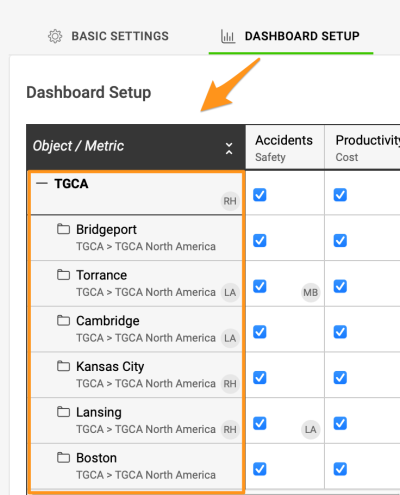
Add several org. units. Add more than one organization unit.
-
Save the dashboard. Click Save & Return. The matrix format dashboard is displayed as in the image below.
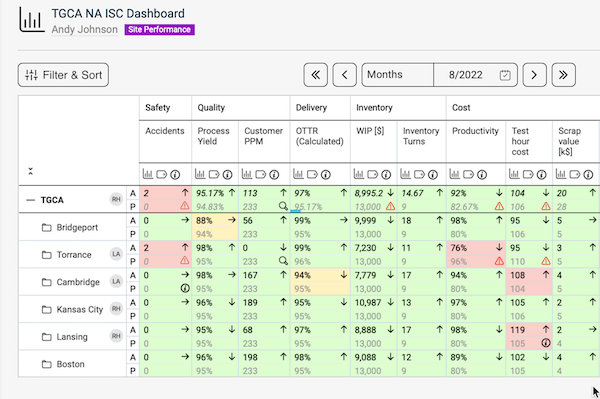
矩阵格式非常适合在多个组织单元之间跟踪相同的指标。
-
打开仪表板设置。 点击指标仪表板的 编辑 图标。
-
时间段保留在行中。 不要勾选 按列显示时间段 复选框。
-
添加多个组织单元。 添加一个以上的组织单元。
-
保存仪表板。 点击 保存并返回。矩阵格式的仪表板显示效果如下图所示。
还需要帮助吗?
请给我们留言。工作日我们通常会在一小时内回复。