Cómo crear un dashboard de KPI en formato de matriz
Traducción automática del inglés. Se muestra el original en inglés.
The matrix format is great for tracking the same metrics across multiple org. units.
-
Open the dashboard settings. Click the Edit icon of your metric dashboard.

-
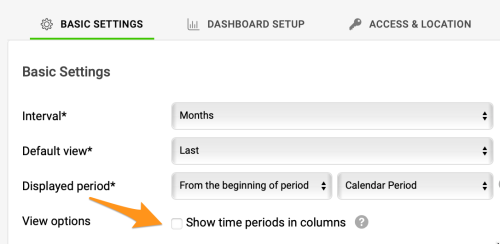
Keep time periods in rows. Leave the Show time periods in columns checkbox unchecked.
-
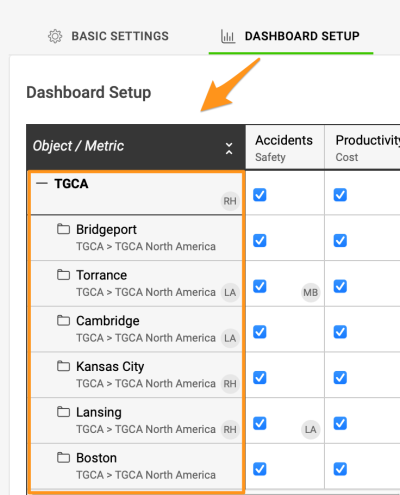
Add several org. units. Add more than one organization unit.
-
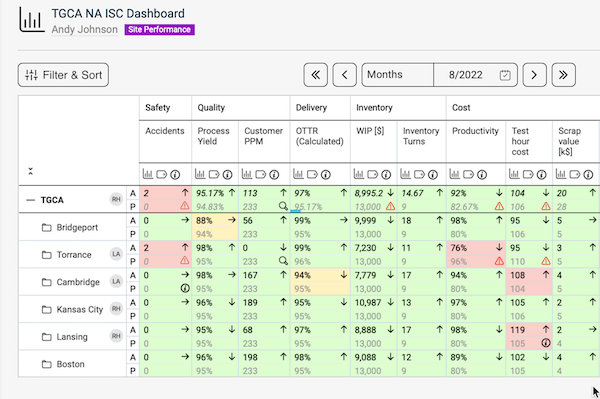
Save the dashboard. Click Save & Return. The matrix format dashboard is displayed as in the image below.
El formato de matriz es ideal para seguir los mismos indicadores en varias unidades organizativas.
-
Abra la configuración del dashboard. Haga clic en el ícono Editar de su dashboard de KPI.
-
Deje los periodos en filas. No marque la casilla Mostrar periodos en columnas.
-
Agregue varias unidades organizativas. Agregue más de una unidad organizativa.
-
Guarde el dashboard. Haga clic en Guardar y volver. El dashboard en formato de matriz se muestra como en la imagen siguiente.
¿Necesita más ayuda?
Escríbanos. En días laborables solemos responder en menos de una hora.