如何显示单个对象(组织单元、合作伙伴等)的图表
本文由英文机器翻译。 当前显示英文原文。
When you use a summary dashboard and need to display graphs for one particular object only, follow these steps:
-
Open your dashboard. Go to your dashboard.
-
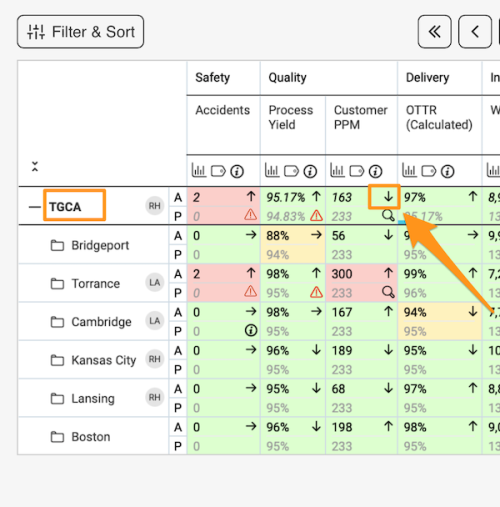
Click the arrow next to a value. Click the small arrow next to a metric value.
-
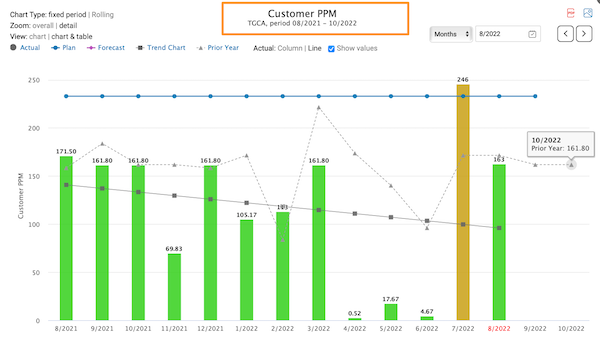
View the graph. The graph for that object is displayed.
Related article: How to display and print an individual dashboard for a supplier / org. unit from the main dashboard
使用汇总仪表板时,如果只需显示某一个对象的图表,请按以下步骤操作:
-
打开仪表板。 进入您的仪表板。
-
点击数值旁的箭头。 点击指标值旁边的小箭头。
-
查看图表。 系统会显示该对象的图表。
还需要帮助吗?
请给我们留言。工作日我们通常会在一小时内回复。