趋势图和指标仪表板图表视图
本文由英文机器翻译。 当前显示英文原文。
Besides the metric dashboard statistics, you can also view a trend chart and display the metric dashboard in the charts view.
-
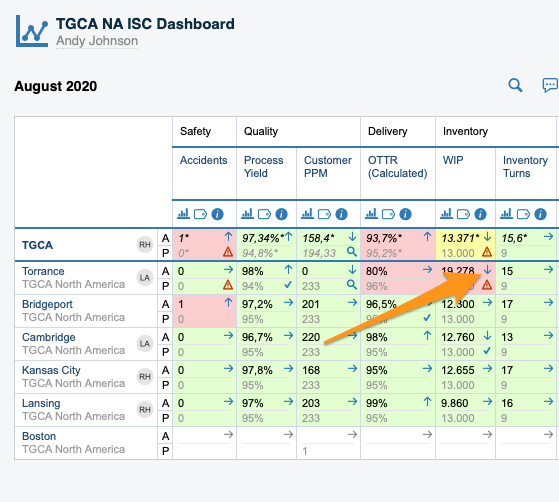
View a trend chart. To view a trend chart for your metric and org. unit, click the trend chart arrow.
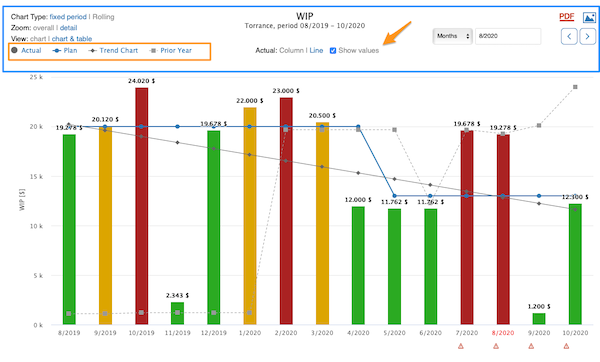
Customize your chart with the available options as you prefer. You can also choose to show values and which lines you want to see: Actual, Plan, Trend Chart and Prior Year. When you click a line’s option, that line is hidden from the chart.
-
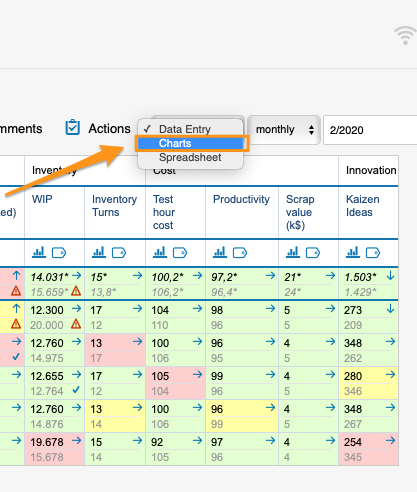
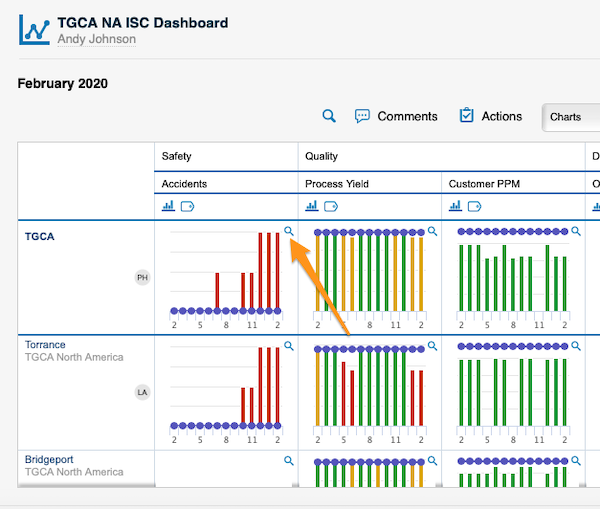
Display the charts view. Display the metric dashboard in the charts view and see more details by clicking the magnifying glass.
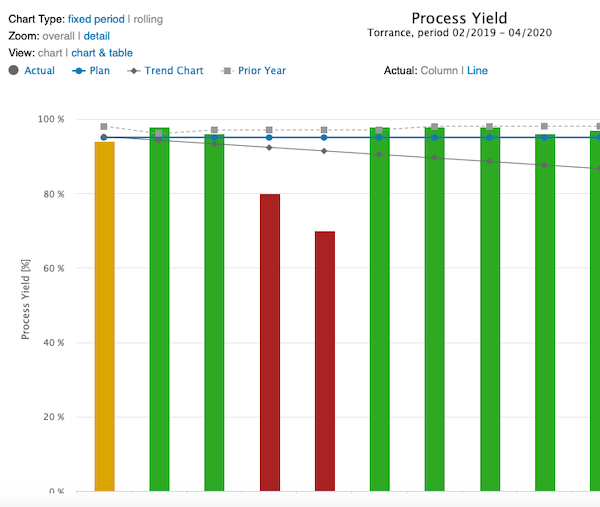
除了指标仪表板统计,您还可以查看趋势图,并以图表视图显示指标仪表板。
-
查看趋势图。 要查看某个指标和组织单元的趋势图,请点击趋势图箭头。
可以使用可用选项按需自定义图表,还可以选择是否显示数值以及要查看的线条:实际值、计划值、趋势图 和 上年。点击某条线的选项后,该线会在图表中隐藏。
-
显示图表视图。 以图表视图显示指标仪表板,点击放大镜可查看更多详情。
还需要帮助吗?
请给我们留言。工作日我们通常会在一小时内回复。