指标仪表板统计
本文由英文机器翻译。 当前显示英文原文。
View your metric dashboard statistics in a chart and customize it based on your preference.
You can also learn about the trend chart and metric dashboard charts view functionality.
Watch the video guide, or follow the text instructions below.
View the statistics
-
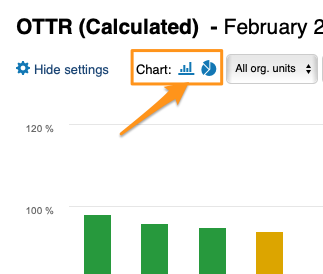
Open the statistics. Click the column chart icon to view your dashboard statistics. The screenshots show the icon in different dashboard views.
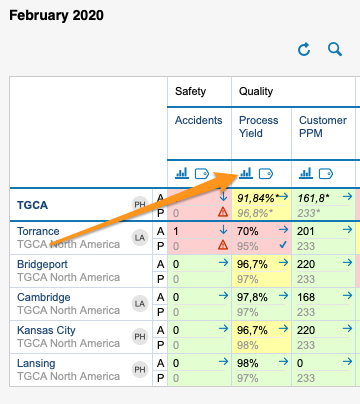
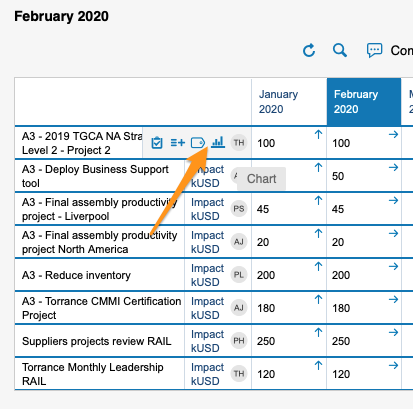
You can view statistics only if there is more than one org. unit, project or partner in your dashboard.
-
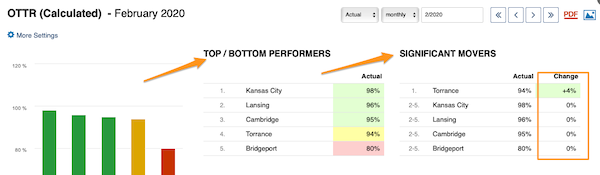
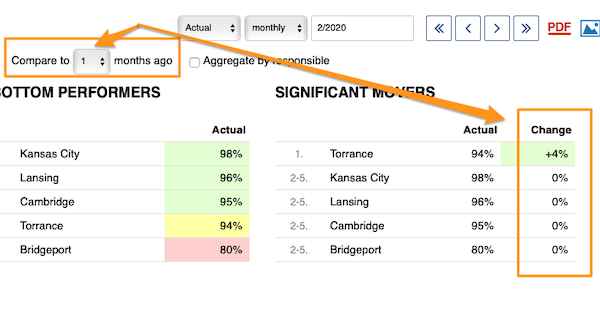
Read the basic view. The basic view shows your base (input) units, the Top/Bottom performers (sorted from the best results down) and the Significant Movers, with an extra column comparing the performance with the last period.
-
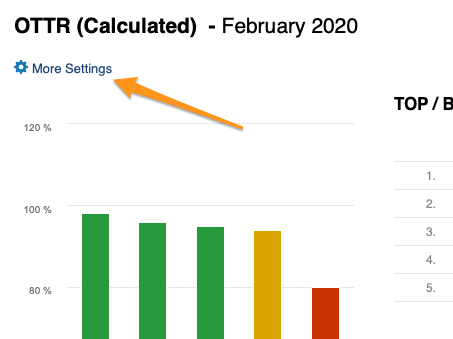
Open More Settings. Click the More Settings button in the upper left corner to customize your view.
Customize the statistics
Choose a bar or pie chart
Choose either the bar or the pie chart view.
Select the units
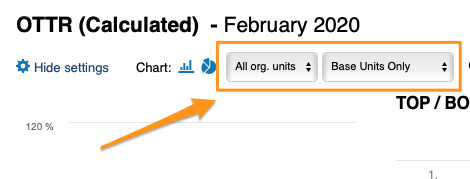
Select the units you want to view in your chart.
Compare to previous periods
With Compare to, you choose from the submenu how many periods (1–12) to go back to compare the performance with the current period under Significant Movers.
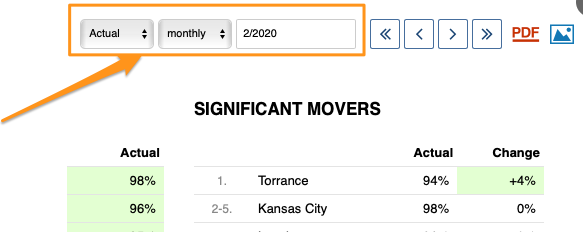
The period is based on your selection.
Show the change in values or percent
You can display the change in performance compared with another time period either in absolute values or in percent.
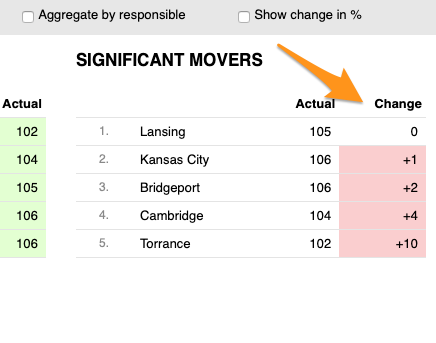
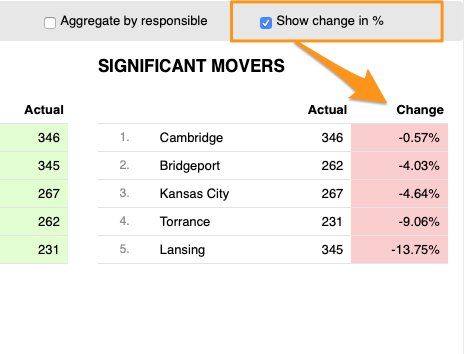
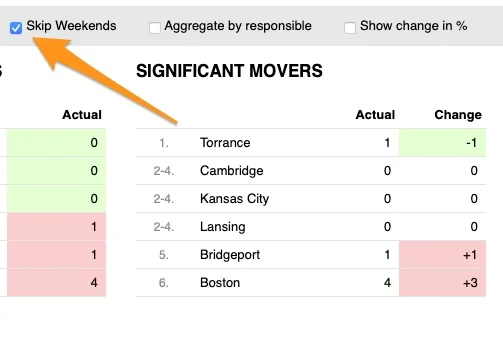
Skip weekends
You can also Skip Weekends in the comparison data of your significant movers.
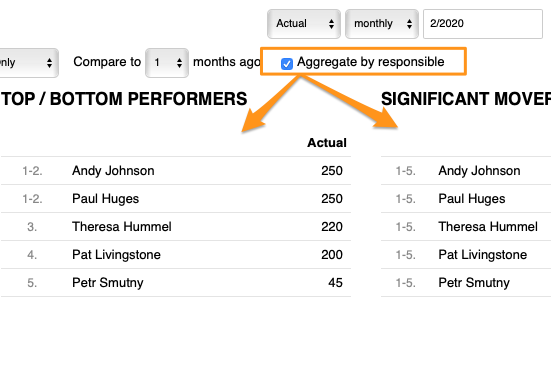
Aggregate by responsible
With Aggregate by responsible, you can summarize the data for all org. units or projects in the dashboard per responsible person.
Set up the responsible in the metric dashboard
Use the project leader in automatic dashboards
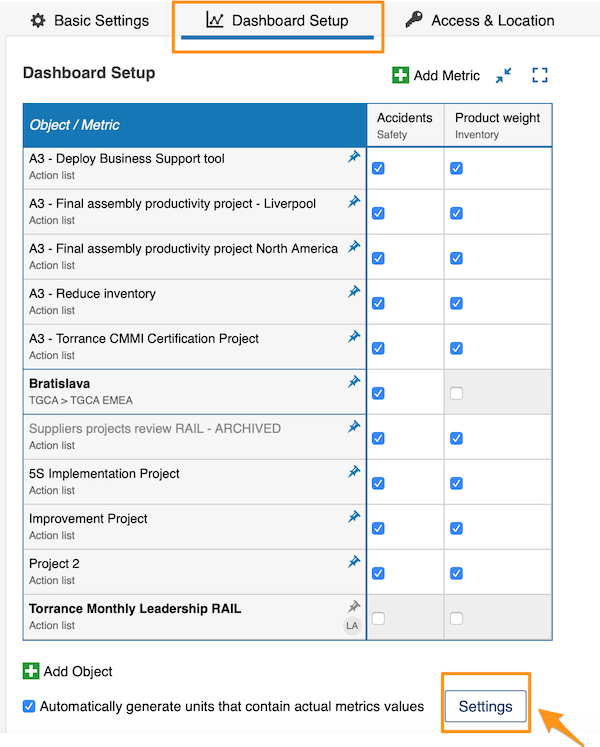
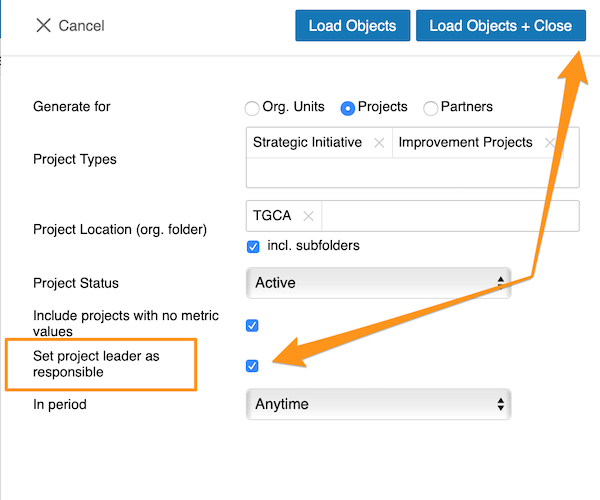
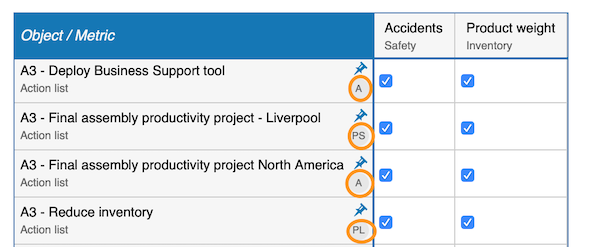
When you use an automatic metric dashboard, click the Settings button at the bottom and tick the Set project leader as responsible box. The responsible is then added to your dashboard automatically.
Choose the responsible per cell
If you do not use an automatic metric dashboard, or you want to choose your responsible manually, go to your dashboard settings and open the Dashboard Setup tab.
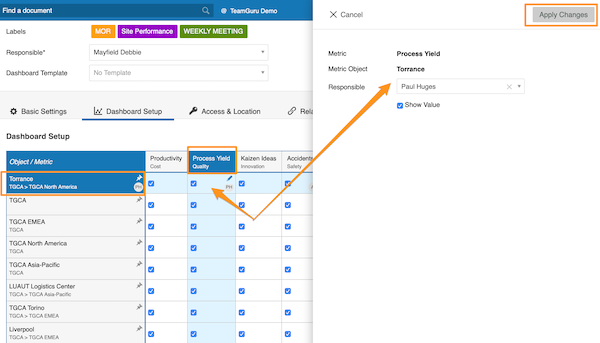
There, you can select the responsible for an org. unit and metric combination: click the cell, add your responsible and apply the changes.
Choose the responsible per org. unit
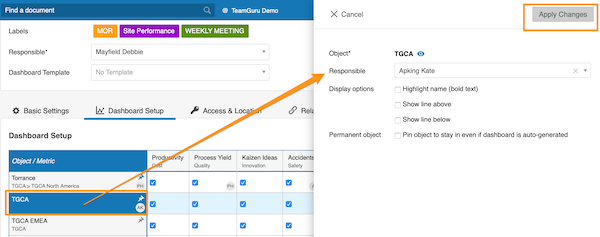
Alternatively, select the responsible for the whole org. unit: click the org. unit, choose the responsible and apply the changes.
See the responsible in the dashboard
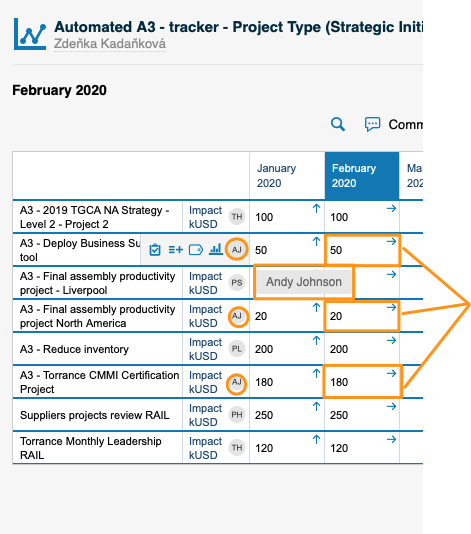
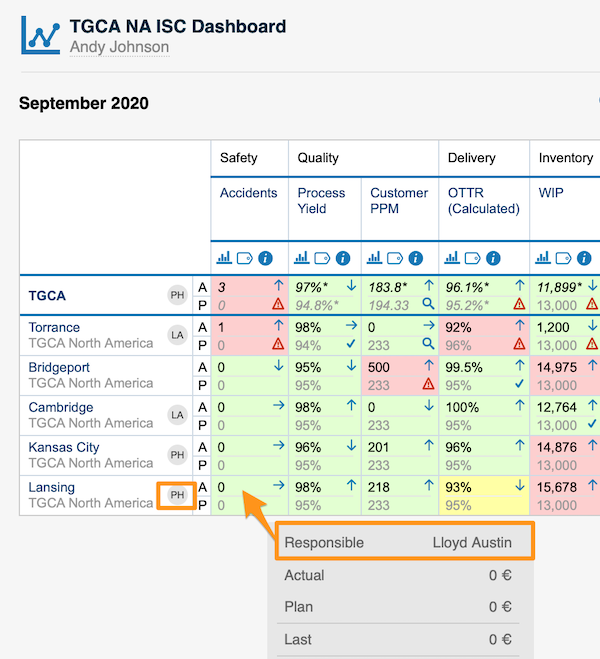
For an org. unit or project, the responsible’s initials are displayed right next to it; when you hover over the initials, you see the full name.
For an org. unit and metric combination, the responsible is shown in a pop-up window along with other data when you hover over the cell.
You can assign only one responsible per project.
以图表形式查看指标仪表板的统计数据,并按需自定义。
您还可以了解趋势图和指标仪表板图表视图功能。
观看视频指南,或按照下方的文字说明操作。
查看统计数据
-
打开统计。 点击柱形图图标查看仪表板统计数据。截图显示了该图标在不同仪表板视图中的位置。
只有当仪表板中包含多个组织单元、项目或合作伙伴时,才能查看统计数据。
-
查看基本视图。 基本视图显示基础(输入)单元、最佳/最差 表现者(按结果从好到差排序)以及 显著变化项,另有一列与上一周期的表现进行对比。
-
打开更多设置。 点击左上角的 更多设置 按钮自定义视图。
自定义统计
选择条形图或饼图
选择条形图或饼图视图。
选择单元
选择要在图表中查看的单元。
与之前的周期对比
通过 对比,可以从子菜单中选择往前追溯多少个周期(1–12),在 显著变化项 中与当前周期的表现进行对比。
对比周期取决于您的选择。
以数值或百分比显示变化
与其他时间周期相比的表现变化,可以用绝对值或百分比显示。
跳过周末
在显著变化项的对比数据中,还可以选择 跳过周末。
按负责人汇总
使用 按负责人汇总,可以按负责人汇总仪表板中所有组织单元或项目的数据。
在指标仪表板中设置负责人
在自动仪表板中使用项目负责人
使用自动指标仪表板时,点击底部的 设置 按钮,勾选 将项目负责人设为负责人 复选框。负责人随即会自动添加到仪表板中。
按单元格选择负责人
如果您不使用自动指标仪表板,或希望手动选择负责人,请进入仪表板设置,打开 仪表板配置 选项卡。
在该选项卡中,可以为组织单元与指标的组合选择负责人:点击单元格,添加负责人并应用更改。
按组织单元选择负责人
也可以为整个组织单元选择负责人:点击组织单元,选择负责人并应用更改。
在仪表板中查看负责人
对于组织单元或项目,负责人的姓名首字母会显示在其旁边;将鼠标悬停在首字母上,即可看到全名。
对于组织单元与指标的组合,将鼠标悬停在单元格上时,负责人会与其他数据一起显示在弹出窗口中。
每个项目只能指定一名负责人。
还需要帮助吗?
请给我们留言。工作日我们通常会在一小时内回复。