Trendový graf a zobrazení grafů metrikového dashboardu
Strojový překlad z angličtiny. Zobrazen anglický originál.
Besides the metric dashboard statistics, you can also view a trend chart and display the metric dashboard in the charts view.
-
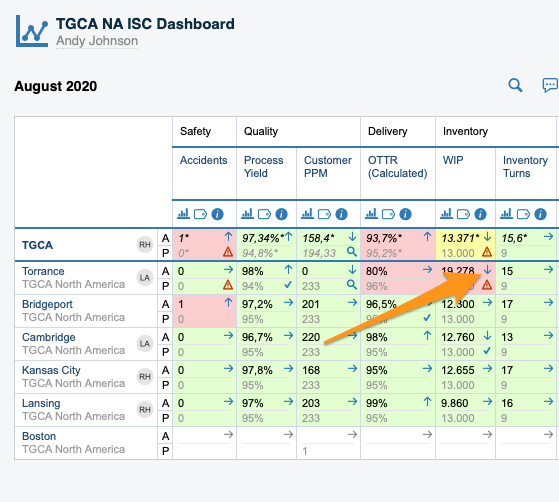
View a trend chart. To view a trend chart for your metric and org. unit, click the trend chart arrow.
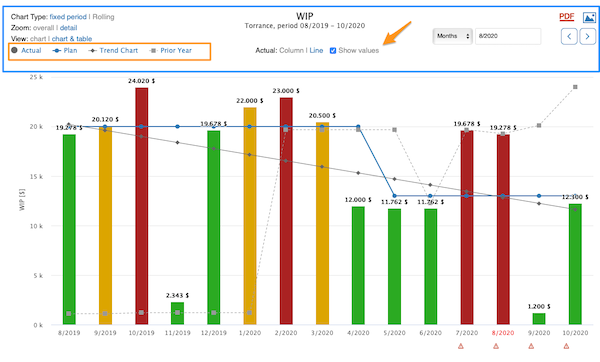
Customize your chart with the available options as you prefer. You can also choose to show values and which lines you want to see: Actual, Plan, Trend Chart and Prior Year. When you click a line’s option, that line is hidden from the chart.
-
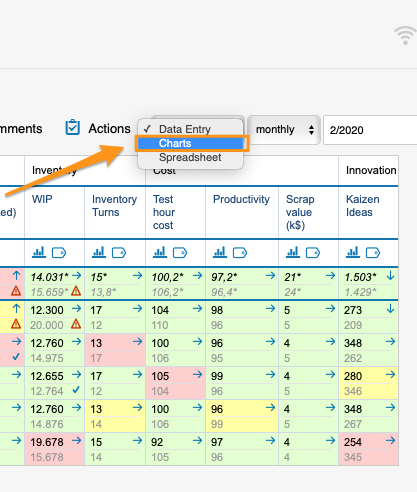
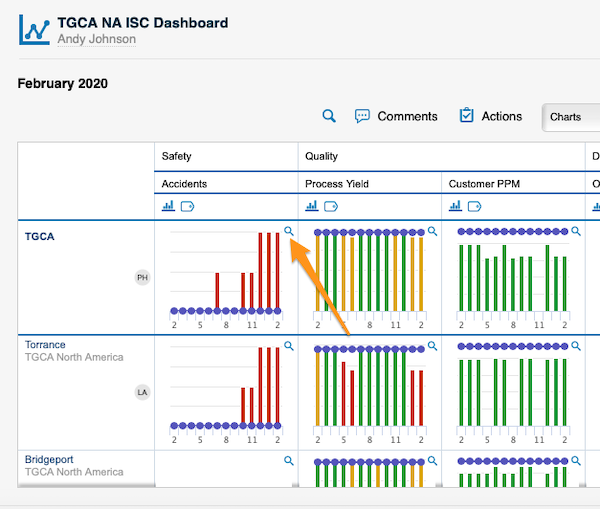
Display the charts view. Display the metric dashboard in the charts view and see more details by clicking the magnifying glass.
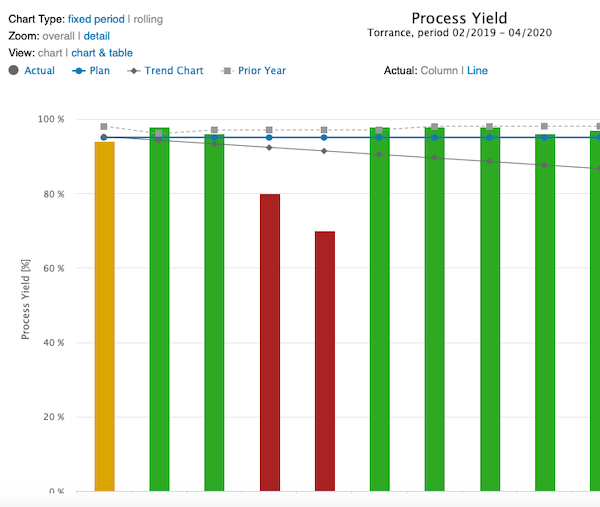
Kromě statistik metrikového dashboardu si můžete zobrazit také trendový graf a metrikový dashboard v zobrazení grafů.
-
Zobrazte trendový graf. Trendový graf pro metriku a organizační jednotku zobrazíte kliknutím na šipku trendového grafu.
Graf si upravte pomocí dostupných možností. Můžete také zvolit zobrazení hodnot a čar, které chcete vidět: Skutečnost, Plán, Trendový graf a Minulý rok. Kliknutím na volbu čáry tuto čáru v grafu skryjete.
-
Zobrazte grafy. Zobrazte metrikový dashboard v zobrazení grafů; podrobnosti uvidíte po kliknutí na lupu.
Potřebujete další pomoc?
Napište nám. V pracovní dny obvykle odpovídáme do hodiny.