Statistiky metrikového dashboardu
Strojový překlad z angličtiny. Zobrazen anglický originál.
View your metric dashboard statistics in a chart and customize it based on your preference.
You can also learn about the trend chart and metric dashboard charts view functionality.
Watch the video guide, or follow the text instructions below.
View the statistics
-
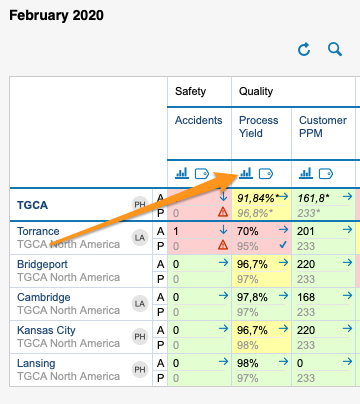
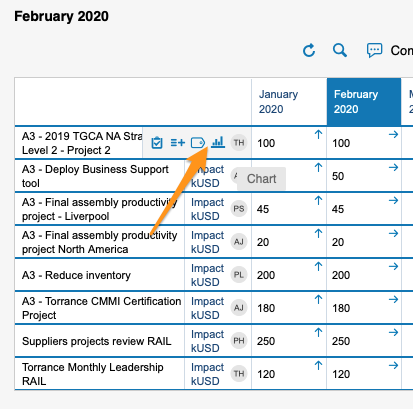
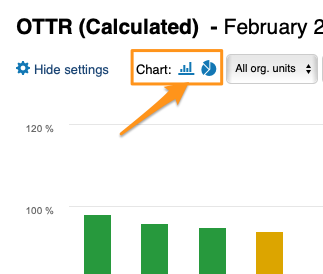
Open the statistics. Click the column chart icon to view your dashboard statistics. The screenshots show the icon in different dashboard views.
You can view statistics only if there is more than one org. unit, project or partner in your dashboard.
-
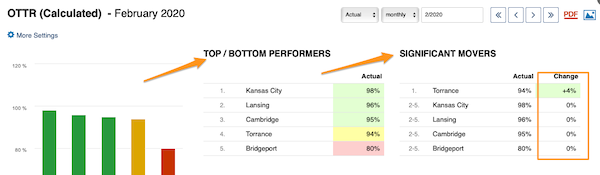
Read the basic view. The basic view shows your base (input) units, the Top/Bottom performers (sorted from the best results down) and the Significant Movers, with an extra column comparing the performance with the last period.
-
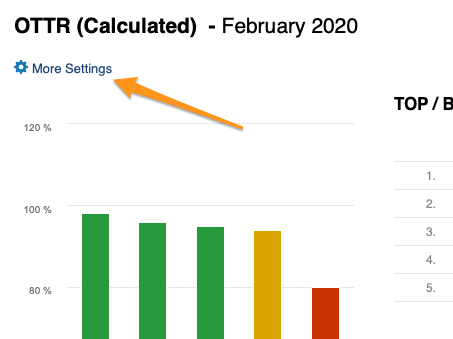
Open More Settings. Click the More Settings button in the upper left corner to customize your view.
Customize the statistics
Choose a bar or pie chart
Choose either the bar or the pie chart view.
Select the units
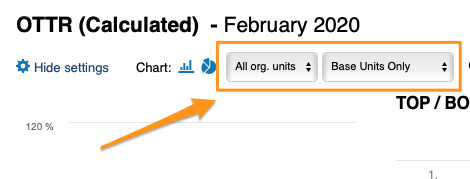
Select the units you want to view in your chart.
Compare to previous periods
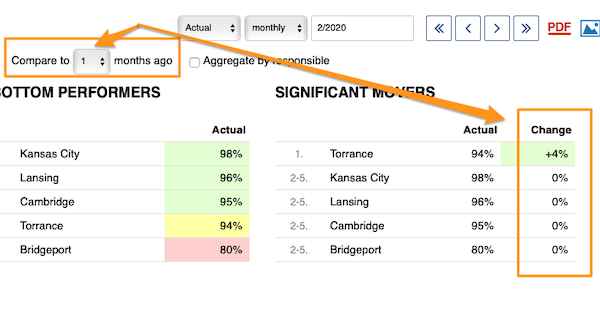
With Compare to, you choose from the submenu how many periods (1–12) to go back to compare the performance with the current period under Significant Movers.
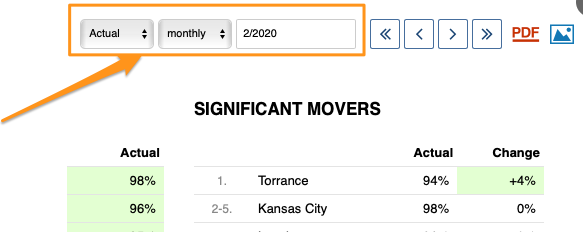
The period is based on your selection.
Show the change in values or percent
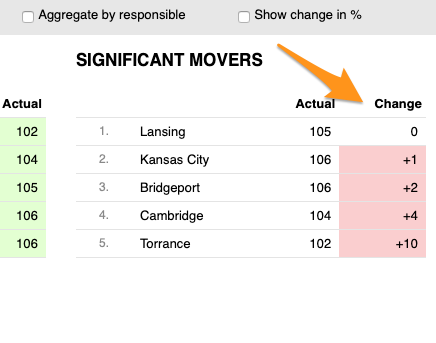
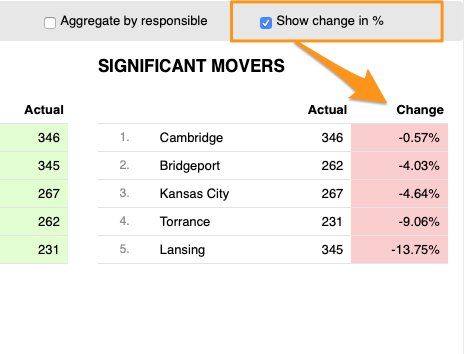
You can display the change in performance compared with another time period either in absolute values or in percent.
Skip weekends
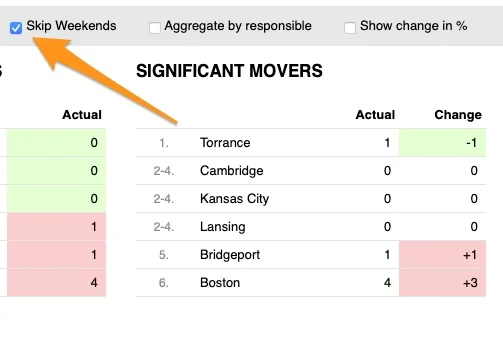
You can also Skip Weekends in the comparison data of your significant movers.
Aggregate by responsible
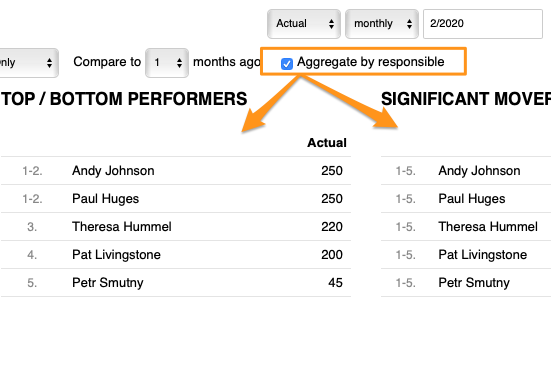
With Aggregate by responsible, you can summarize the data for all org. units or projects in the dashboard per responsible person.
Set up the responsible in the metric dashboard
Use the project leader in automatic dashboards
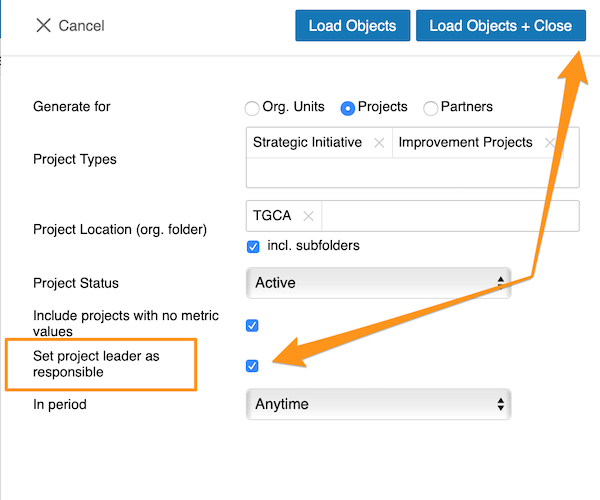
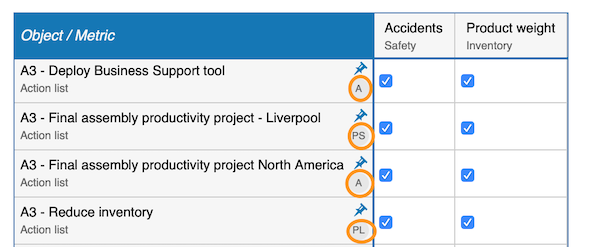
When you use an automatic metric dashboard, click the Settings button at the bottom and tick the Set project leader as responsible box. The responsible is then added to your dashboard automatically.
Choose the responsible per cell
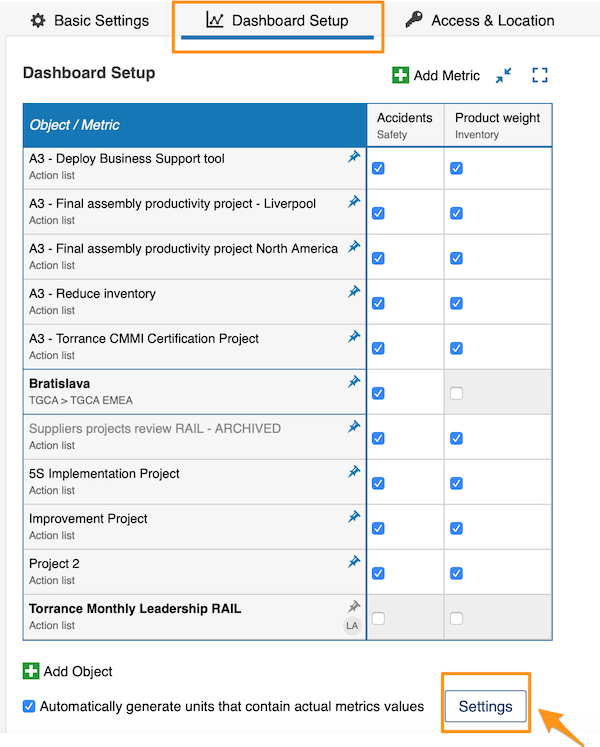
If you do not use an automatic metric dashboard, or you want to choose your responsible manually, go to your dashboard settings and open the Dashboard Setup tab.
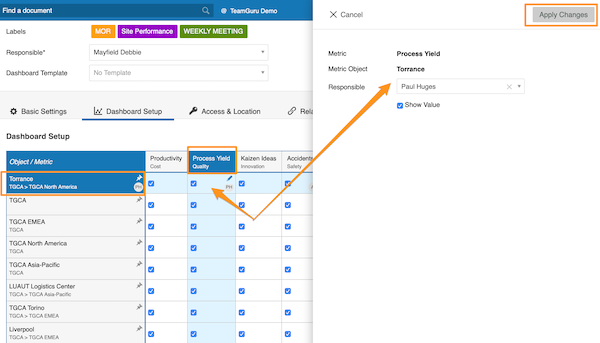
There, you can select the responsible for an org. unit and metric combination: click the cell, add your responsible and apply the changes.
Choose the responsible per org. unit
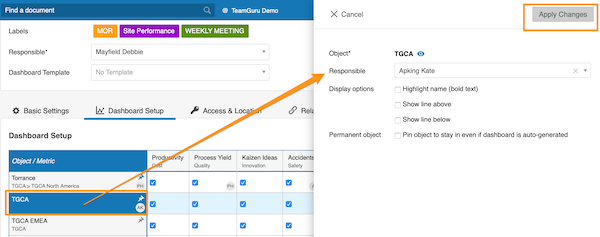
Alternatively, select the responsible for the whole org. unit: click the org. unit, choose the responsible and apply the changes.
See the responsible in the dashboard
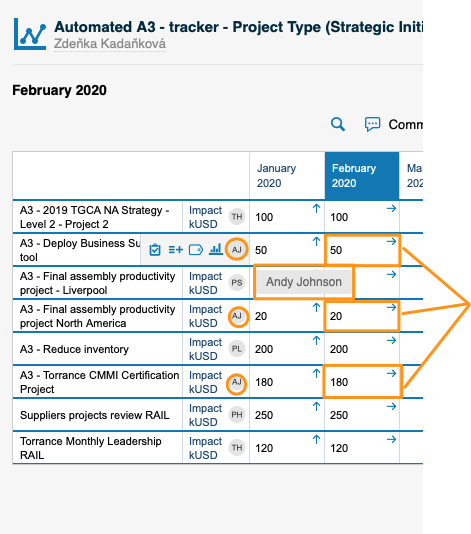
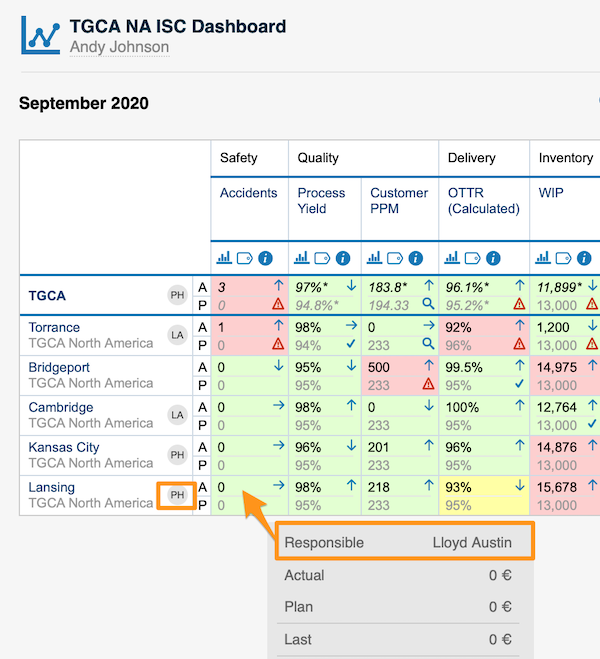
For an org. unit or project, the responsible’s initials are displayed right next to it; when you hover over the initials, you see the full name.
For an org. unit and metric combination, the responsible is shown in a pop-up window along with other data when you hover over the cell.
You can assign only one responsible per project.
Zobrazte si statistiky metrikového dashboardu v grafu a upravte si je podle svých potřeb.
Můžete se také seznámit s funkcí trendového grafu a zobrazení grafů metrikového dashboardu.
Podívejte se na video návod, nebo postupujte podle textového návodu níže.
Zobrazení statistik
-
Otevřete statistiky. Statistiky dashboardu zobrazíte kliknutím na ikonu sloupcového grafu. Snímky obrazovky ukazují ikonu v různých zobrazeních dashboardu.
Statistiky jsou k dispozici, jen pokud je v dashboardu více než jedna organizační jednotka, projekt nebo partner.
-
Základní zobrazení. Základní zobrazení ukazuje vaše základní (vstupní) jednotky, nejlepší/nejhorší výsledky (seřazené od nejlepšího) a největší změny s dalším sloupcem, který porovnává výkon s posledním obdobím.
-
Otevřete Další nastavení. Zobrazení upravíte tlačítkem Další nastavení vlevo nahoře.
Úprava statistik
Sloupcový nebo koláčový graf
Zvolte zobrazení sloupcového nebo koláčového grafu.
Výběr jednotek
Vyberte jednotky, které chcete v grafu zobrazit.
Porovnání s předchozími obdobími
V podnabídce Porovnat s zvolíte, o kolik období (1–12) zpět se má výkon porovnat s aktuálním obdobím v části Největší změny.
Období se řídí vaším výběrem.
Změna v hodnotách nebo v procentech
Změnu výkonu oproti jinému období můžete zobrazit v absolutních hodnotách nebo v procentech.
Vynechání víkendů
Ve srovnávacích datech největších změn můžete také zvolit Vynechat víkendy.
Souhrn podle odpovědné osoby
Volbou Souhrn podle odpovědné osoby sečtete data všech organizačních jednotek nebo projektů v dashboardu za každou odpovědnou osobu.
Nastavení odpovědné osoby v metrikovém dashboardu
Vedoucí projektu v automatických dashboardech
Pokud používáte automatický metrikový dashboard, klikněte dole na tlačítko Nastavení a zaškrtněte políčko Nastavit vedoucího projektu jako odpovědnou osobu. Odpovědná osoba se pak do dashboardu přidá automaticky.
Odpovědná osoba pro jednotlivé buňky
Pokud nepoužíváte automatický metrikový dashboard nebo chcete odpovědnou osobu vybrat ručně, přejděte do nastavení dashboardu a otevřete záložku Sestavení dashboardu.
Tam můžete vybrat odpovědnou osobu pro kombinaci organizační jednotky a metriky: klikněte na buňku, přidejte odpovědnou osobu a změny použijte.
Odpovědná osoba pro organizační jednotku
Případně vyberte odpovědnou osobu pro celou organizační jednotku: klikněte na organizační jednotku, vyberte odpovědnou osobu a změny použijte.
Zobrazení odpovědné osoby v dashboardu
U organizační jednotky nebo projektu se hned vedle zobrazují iniciály odpovědné osoby; po najetí myší na iniciály uvidíte celé jméno.
U kombinace organizační jednotky a metriky se odpovědná osoba zobrazí spolu s dalšími údaji ve vyskakovacím okně, když najedete myší na buňku.
Každému projektu můžete přiřadit jen jednu odpovědnou osobu.
Potřebujete další pomoc?
Napište nám. V pracovní dny obvykle odpovídáme do hodiny.