Cómo mostrar los valores de pronóstico en un dashboard
Traducción automática del inglés. Se muestra el original en inglés.
To display forecast values in your dashboard, follow these steps:
-
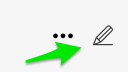
Open the dashboard settings. Click the dashboard Edit icon.
-
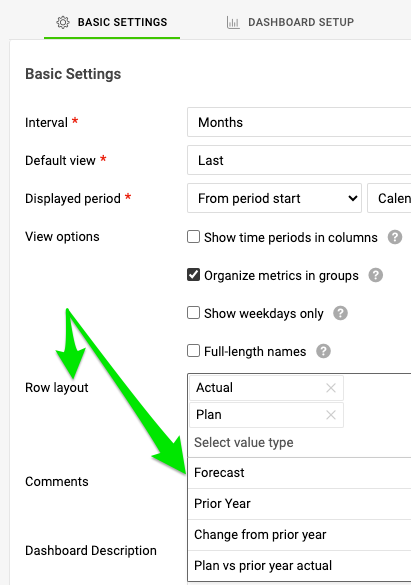
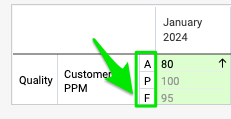
Select the rows to display. On the Basic Settings tab, in the Row layout section, select the rows you want to display on your dashboard.
-
Save the settings. Click the Save & Return button.

Para mostrar los valores de pronóstico en su dashboard, siga estos pasos:
-
Abra la configuración del dashboard. Haga clic en el ícono Editar del dashboard.
-
Elija las filas que se muestran. En la pestaña Configuración básica, sección Diseño de filas, elija las filas que quiere mostrar en el dashboard.
-
Guarde la configuración. Haga clic en el botón Guardar y volver.
¿Necesita más ayuda?
Escríbanos. En días laborables solemos responder en menos de una hora.