Como exibir valores do ano anterior em um dashboard
Tradução automática do inglês. Exibindo o original em inglês.
Besides actual, plan and forecast values, you can view prior year data and the percentage change of the actual values from the prior year.
Video guide
The text instructions follow below the video.
View prior year values and the change from the prior year
-
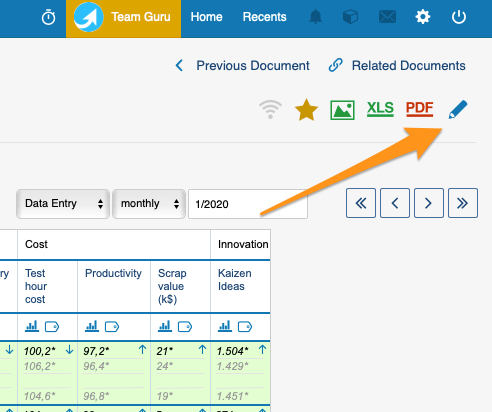
Open the dashboard settings. Go to your dashboard settings.
-
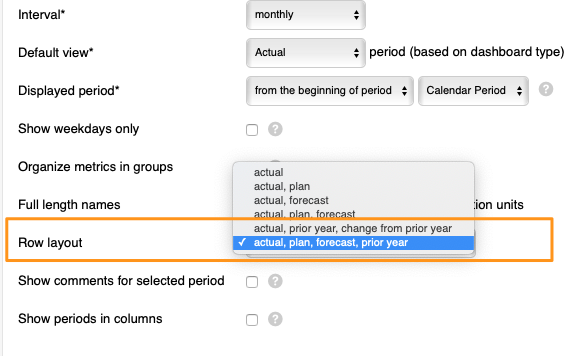
Choose the row layout. Scroll down to Row layout and select either Actual, plan, forecast, prior year or Actual, prior year, change from prior year from the menu.
-
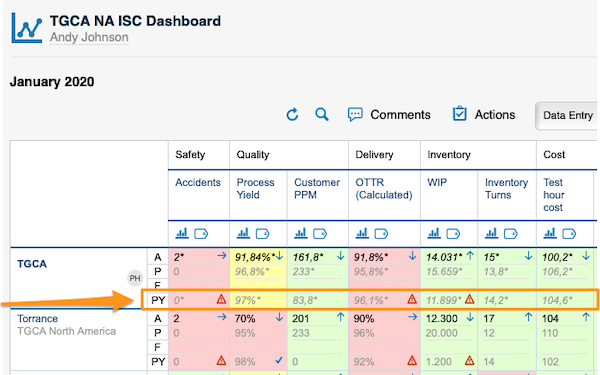
View the values. Your dashboard displays the values based on your selection. PY stands for prior year values:
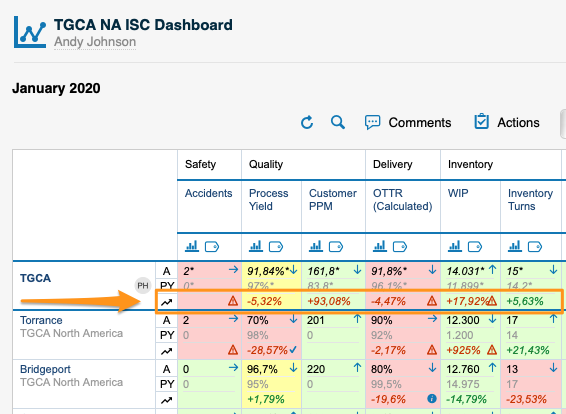
The change from prior year values:
PY values are filled in automatically by the system with the actual values of the prior year. To see PY values, you have to upload the actual values for the previous year into the system.
Além dos valores real, meta e previsão, você pode ver os dados do ano anterior e a variação percentual dos valores reais em relação ao ano anterior.
Guia em vídeo
As instruções em texto estão abaixo do vídeo.
Veja os valores do ano anterior e a variação em relação a ele
-
Abra as configurações do dashboard. Acesse as configurações do dashboard.
-
Escolha o layout das linhas. Role até Layout das linhas e selecione no menu Real, meta, previsão, ano anterior ou Real, ano anterior, variação em relação ao ano anterior.
-
Veja os valores. O dashboard exibe os valores conforme a sua seleção. PY indica os valores do ano anterior:
A variação em relação ao ano anterior:
O sistema preenche os valores PY automaticamente com os valores reais do ano anterior. Para ver os valores PY, você precisa carregar no sistema os valores reais do ano anterior.
Precisa de mais ajuda?
Escreva para nós. Em dias úteis, costumamos responder em até uma hora.