Cómo mostrar los valores del año anterior en un dashboard
Traducción automática del inglés. Se muestra el original en inglés.
Besides actual, plan and forecast values, you can view prior year data and the percentage change of the actual values from the prior year.
Video guide
The text instructions follow below the video.
View prior year values and the change from the prior year
-
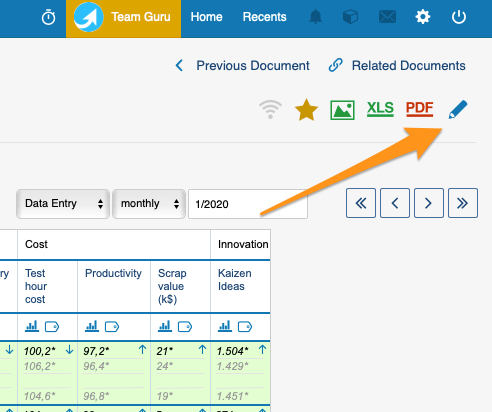
Open the dashboard settings. Go to your dashboard settings.
-
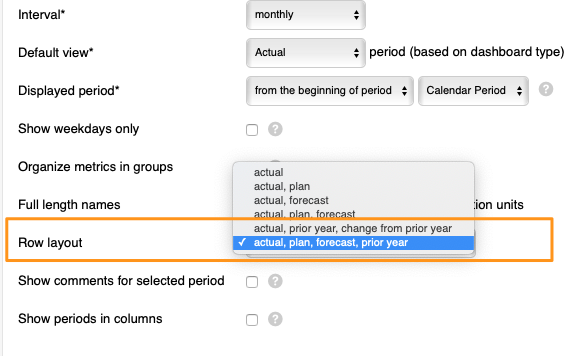
Choose the row layout. Scroll down to Row layout and select either Actual, plan, forecast, prior year or Actual, prior year, change from prior year from the menu.
-
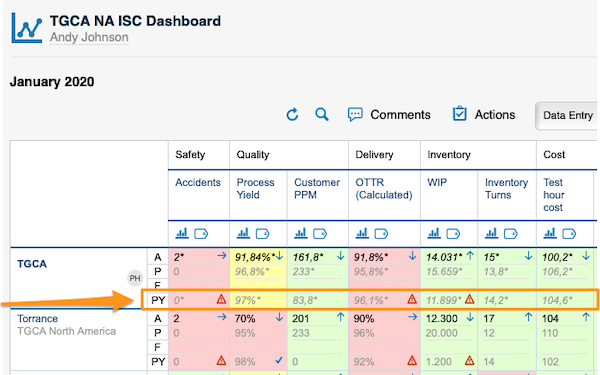
View the values. Your dashboard displays the values based on your selection. PY stands for prior year values:
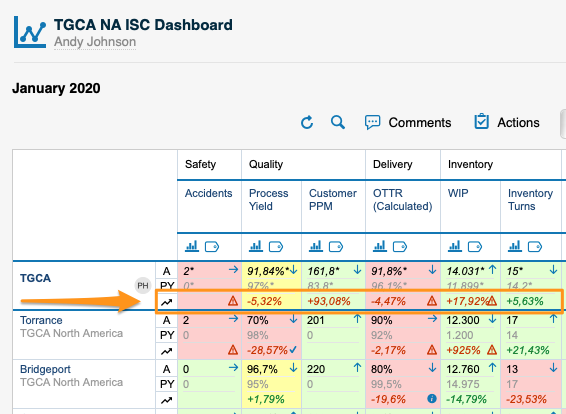
The change from prior year values:
PY values are filled in automatically by the system with the actual values of the prior year. To see PY values, you have to upload the actual values for the previous year into the system.
Además de los valores reales, de plan y de pronóstico, puede ver los datos del año anterior y la variación porcentual de los valores reales respecto al año anterior.
Video
Las instrucciones escritas están debajo del video.
Ver los valores del año anterior y la variación respecto al año anterior
-
Abra la configuración del dashboard. Vaya a la configuración de su dashboard.
-
Elija el diseño de filas. Desplácese hasta Diseño de filas y seleccione en el menú Real, plan, pronóstico, año anterior o Real, año anterior, variación respecto al año anterior.
-
Vea los valores. El dashboard muestra los valores según su selección. PY indica los valores del año anterior:
La variación respecto al año anterior:
El sistema completa automáticamente los valores PY con los valores reales del año anterior. Para ver valores PY, debe cargar en el sistema los valores reales del año anterior.
¿Necesita más ayuda?
Escríbanos. En días laborables solemos responder en menos de una hora.