How to set up object hierarchy in your dashboard
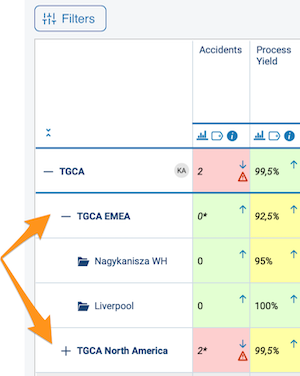
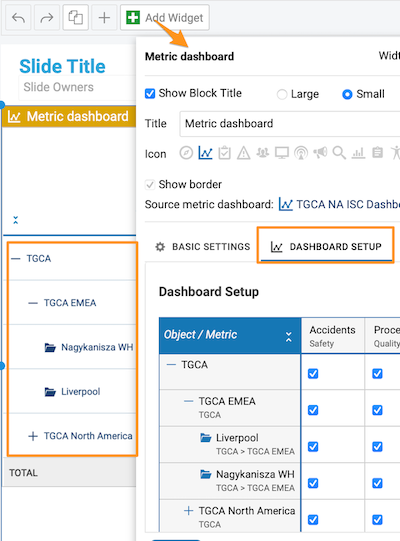
You can display the objects on your dashboard in a tree structure hierarchy, which lets you collapse and expand individual sections as needed. Large dashboards become clearer, with an option to drill down to lower levels.
Set up the hierarchy
Open the dashboard setup
To set up the hierarchy, go to your dashboard settings and open the Dashboard Setup tab.
Drag objects into place
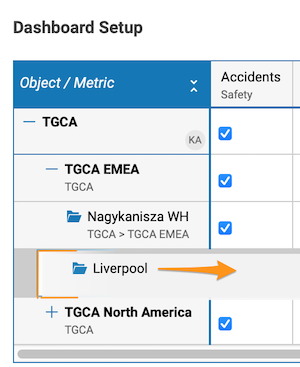
Click the object you want to move (e.g. Paris), drag it to the right or left, and drop it where it is needed.
Add objects as a sub-level
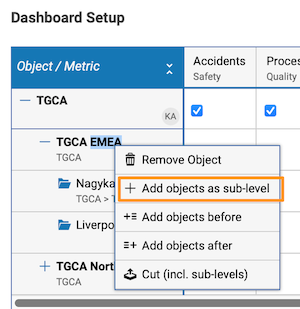
Alternatively, right-click the object and choose Add objects as sub-level.
The initial default setup in the settings is displayed the same way in your dashboard.
Use the hierarchy
Expand or collapse an object
To expand an object in the dashboard view, click the plus symbol next to it. To collapse it, click the minus symbol.
Expand or collapse all objects
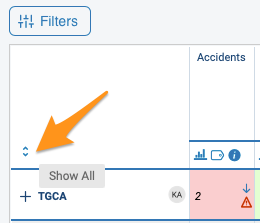
To collapse or expand all the objects in your dashboard, use the arrow symbols above the objects.
Use the tree in reports
You can also use the same tree structure in your reports with the Metric Dashboards widget.
Still need help?
Write to us. We usually reply within an hour on business days.