Como configurar a hierarquia de objetos no dashboard
Tradução automática do inglês. Exibindo o original em inglês.
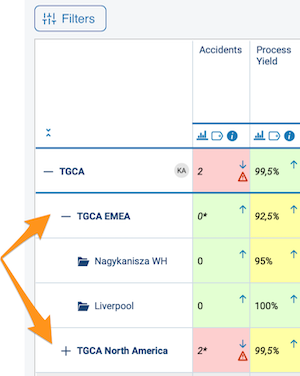
You can display the objects on your dashboard in a tree structure hierarchy, which lets you collapse and expand individual sections as needed. Large dashboards become clearer, with an option to drill down to lower levels.
Set up the hierarchy
Open the dashboard setup
To set up the hierarchy, go to your dashboard settings and open the Dashboard Setup tab.
Drag objects into place
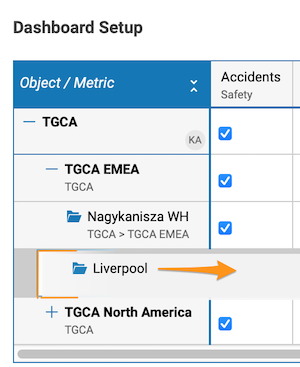
Click the object you want to move (e.g. Paris), drag it to the right or left, and drop it where it is needed.
Add objects as a sub-level
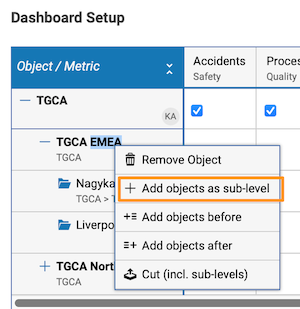
Alternatively, right-click the object and choose Add objects as sub-level.
The initial default setup in the settings is displayed the same way in your dashboard.
Use the hierarchy
Expand or collapse an object
To expand an object in the dashboard view, click the plus symbol next to it. To collapse it, click the minus symbol.
Expand or collapse all objects
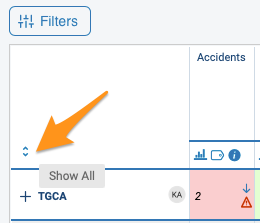
To collapse or expand all the objects in your dashboard, use the arrow symbols above the objects.
Use the tree in reports
You can also use the same tree structure in your reports with the Metric Dashboards widget.
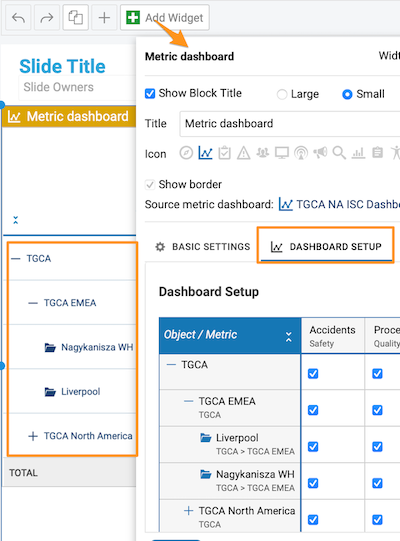
Você pode exibir os objetos do dashboard em uma estrutura hierárquica em árvore, que permite recolher e expandir cada seção conforme a necessidade. Dashboards grandes ficam mais claros, com a opção de detalhar os níveis inferiores.
Configurar a hierarquia
Abrir a configuração do dashboard
Para configurar a hierarquia, abra as configurações do dashboard e vá até a aba Configuração do dashboard.
Arrastar os objetos para o lugar certo
Clique no objeto que quer mover (por exemplo, Paris), arraste-o para a direita ou para a esquerda e solte-o onde for necessário.
Adicionar objetos como subnível
Outra opção é clicar com o botão direito no objeto e escolher Adicionar objetos como subnível.
A configuração inicial feita nas configurações aparece da mesma forma no dashboard.
Usar a hierarquia
Expandir ou recolher um objeto
Para expandir um objeto na visualização do dashboard, clique no sinal de mais ao lado dele. Para recolher, clique no sinal de menos.
Expandir ou recolher todos os objetos
Para recolher ou expandir todos os objetos do dashboard, use os símbolos de seta acima dos objetos.
Usar a árvore nos relatórios
Você também pode usar a mesma estrutura em árvore nos relatórios com o widget Dashboards de KPI.
Precisa de mais ajuda?
Escreva para nós. Em dias úteis, costumamos responder em até uma hora.