Cómo configurar la jerarquía de objetos en el dashboard
Traducción automática del inglés. Se muestra el original en inglés.
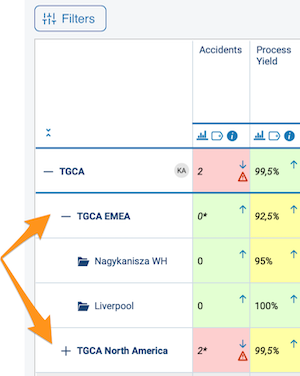
You can display the objects on your dashboard in a tree structure hierarchy, which lets you collapse and expand individual sections as needed. Large dashboards become clearer, with an option to drill down to lower levels.
Set up the hierarchy
Open the dashboard setup
To set up the hierarchy, go to your dashboard settings and open the Dashboard Setup tab.
Drag objects into place
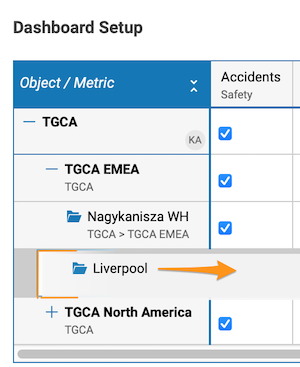
Click the object you want to move (e.g. Paris), drag it to the right or left, and drop it where it is needed.
Add objects as a sub-level
Alternatively, right-click the object and choose Add objects as sub-level.
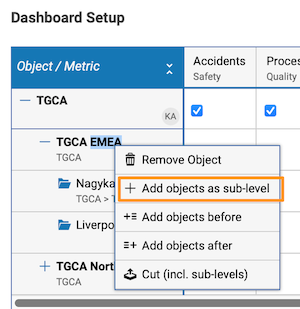
The initial default setup in the settings is displayed the same way in your dashboard.
Use the hierarchy
Expand or collapse an object
To expand an object in the dashboard view, click the plus symbol next to it. To collapse it, click the minus symbol.
Expand or collapse all objects
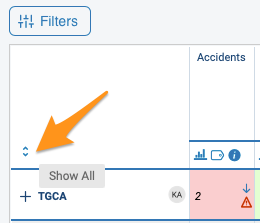
To collapse or expand all the objects in your dashboard, use the arrow symbols above the objects.
Use the tree in reports
You can also use the same tree structure in your reports with the Metric Dashboards widget.
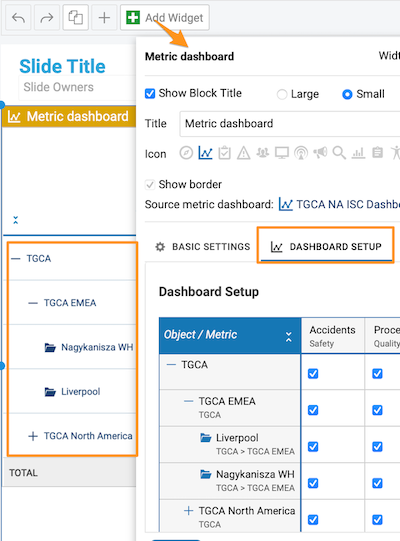
Puede mostrar los objetos del dashboard en una jerarquía en forma de árbol, que le permite contraer y expandir secciones según lo necesite. Los dashboards grandes ganan claridad y puede profundizar en los niveles inferiores.
Configurar la jerarquía
Abrir la configuración del dashboard
Para configurar la jerarquía, abra la configuración del dashboard y vaya a la pestaña Configuración del dashboard.
Arrastrar los objetos a su lugar
Haga clic en el objeto que quiere mover (por ejemplo, París), arrástrelo a la derecha o a la izquierda y suéltelo donde corresponda.
Agregar objetos como subnivel
También puede hacer clic derecho en el objeto y elegir Agregar objetos como subnivel.
La configuración inicial predeterminada se muestra igual en el dashboard.
Usar la jerarquía
Expandir o contraer un objeto
Para expandir un objeto en la vista del dashboard, haga clic en el símbolo de más junto a él. Para contraerlo, haga clic en el símbolo de menos.
Expandir o contraer todos los objetos
Para contraer o expandir todos los objetos del dashboard, use los símbolos de flecha encima de los objetos.
Usar el árbol en los informes
También puede usar la misma estructura de árbol en sus informes con el widget Dashboards de KPI.
¿Necesita más ayuda?
Escríbanos. En días laborables solemos responder en menos de una hora.