如何在仪表板中设置对象层级
本文由英文机器翻译。 当前显示英文原文。
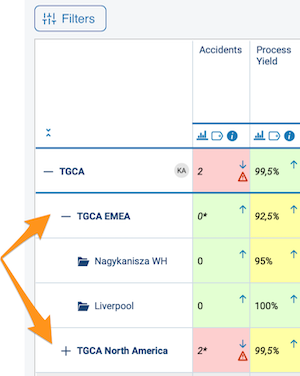
You can display the objects on your dashboard in a tree structure hierarchy, which lets you collapse and expand individual sections as needed. Large dashboards become clearer, with an option to drill down to lower levels.
Set up the hierarchy
Open the dashboard setup
To set up the hierarchy, go to your dashboard settings and open the Dashboard Setup tab.
Drag objects into place
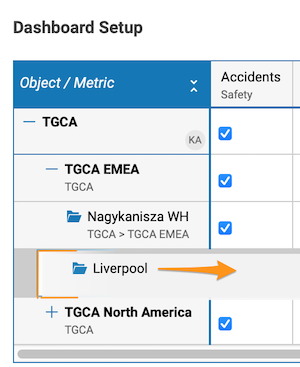
Click the object you want to move (e.g. Paris), drag it to the right or left, and drop it where it is needed.
Add objects as a sub-level
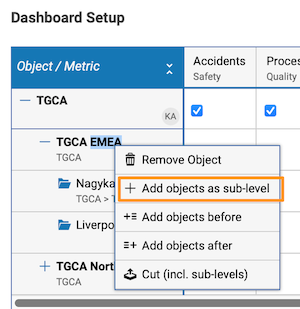
Alternatively, right-click the object and choose Add objects as sub-level.
The initial default setup in the settings is displayed the same way in your dashboard.
Use the hierarchy
Expand or collapse an object
To expand an object in the dashboard view, click the plus symbol next to it. To collapse it, click the minus symbol.
Expand or collapse all objects
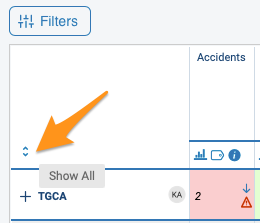
To collapse or expand all the objects in your dashboard, use the arrow symbols above the objects.
Use the tree in reports
You can also use the same tree structure in your reports with the Metric Dashboards widget.
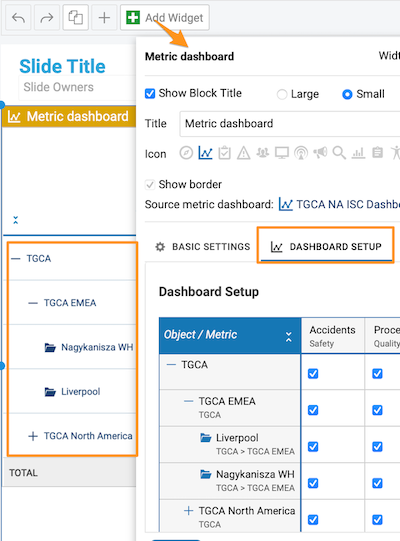
您可以在仪表板中以树形结构层级显示对象,并根据需要折叠和展开各个部分。大型仪表板因此更加清晰,还可以向下钻取到更低层级。
设置层级
打开仪表板设置
要设置层级,请进入仪表板设置,打开仪表板设置选项卡。
将对象拖放到位
点击要移动的对象(例如巴黎),向右或向左拖动,然后放到所需位置。
将对象添加为子级
也可以右键单击对象,选择将对象添加为子级。
设置中的初始默认结构会以相同方式显示在仪表板中。
使用层级
展开或折叠对象
在仪表板视图中,点击对象旁的加号即可展开该对象,点击减号即可折叠。
展开或折叠所有对象
要折叠或展开仪表板中的所有对象,请使用对象上方的箭头符号。
在报告中使用树形结构
您还可以通过指标仪表板组件,在报告中使用相同的树形结构。
还需要帮助吗?
请给我们留言。工作日我们通常会在一小时内回复。