报告模块中的RCCA统计:图表组件
本文由英文机器翻译。 当前显示英文原文。
Connect your RCCA documents with our Reports module, where you can create different types of statistics. Monitor the number of your total, new, open and closed documents, and keep track of your RCCA documents by problem type, location, severity, and more.
Create the chart widget
Add a widget
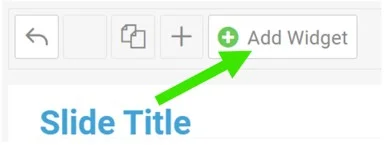
In your report, click Add Widget.
Select the chart
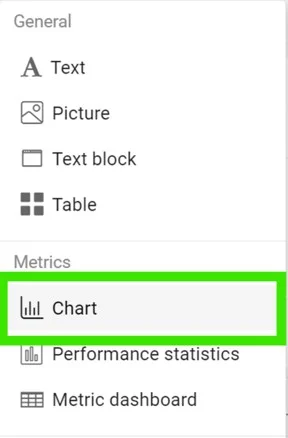
Select Chart from the submenu.
Add a data series
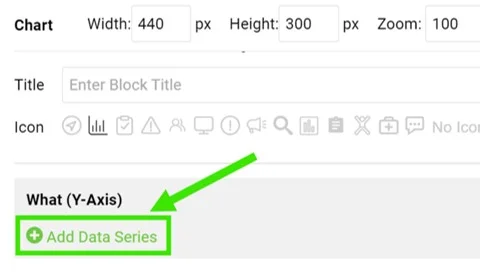
Click Add Data Series.
Select the data source
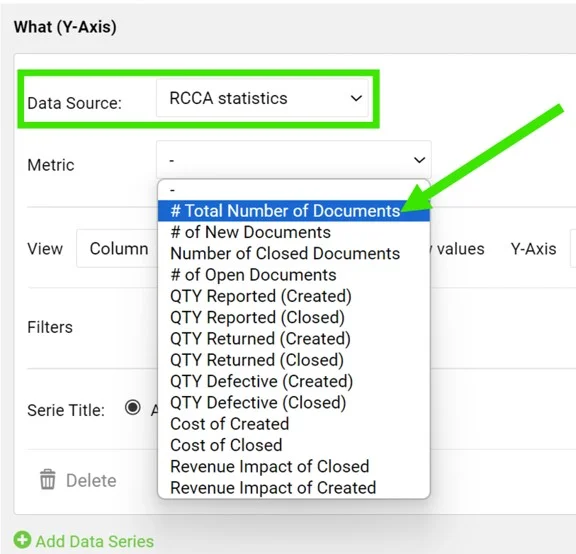
Select RCCA statistics as the data source and choose your metric.
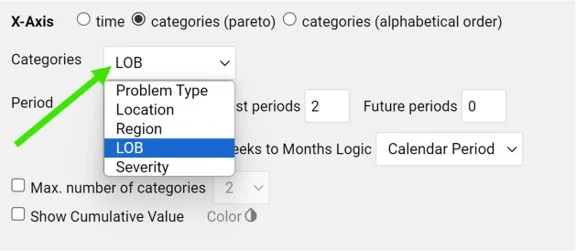
Define the categories
Define the categories, the time period and other settings.
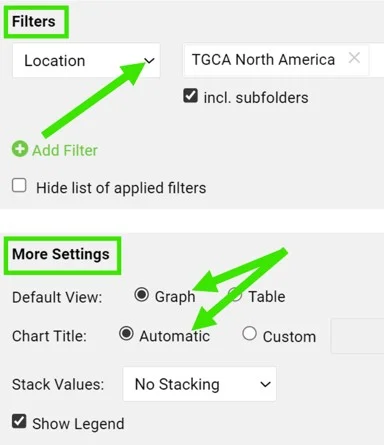
Set filters and the view
You can also set up additional filters (e.g. location, metric, RCCA template, etc.) and the view, title and legend in the More Settings section.
View the statistics
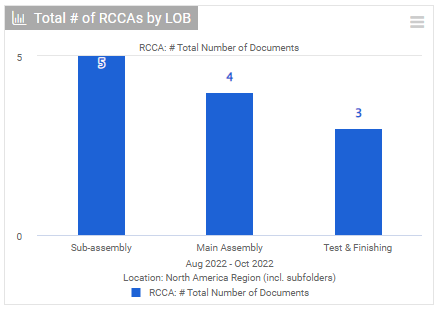
View your charts
View your charts in the report.
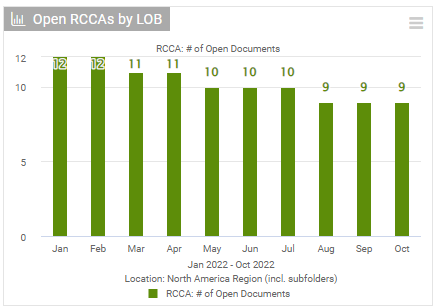
Track development over time
You can also view the development of your RCCA documents over a specific time period.
Please follow this link to learn more about setting up your reports.
将RCCA文档与报告模块连接,即可创建各种统计。监控文档的总数、新建数、未结数和已结数,并按问题类型、地点、严重程度等跟踪RCCA文档。
创建图表组件
添加组件
在报告中,点击添加组件。
选择图表
从子菜单中选择图表。
添加数据系列
点击添加数据系列。
选择数据源
选择RCCA统计作为数据源,并选择指标。
定义类别
定义类别、时间期间和其他设置。
设置筛选条件和视图
您还可以在更多设置部分设置其他筛选条件(例如地点、指标、RCCA模板等),以及视图、标题和图例。
查看统计
查看图表
在报告中查看图表。
跟踪随时间的变化
您还可以查看RCCA文档在特定时间期间内的变化情况。
请点击此链接,详细了解如何设置报告。
还需要帮助吗?
请给我们留言。工作日我们通常会在一小时内回复。