Estadísticas de RCCA en los widgets de gráficos de Informes
Traducción automática del inglés. Se muestra el original en inglés.
Connect your RCCA documents with our Reports module, where you can create different types of statistics. Monitor the number of your total, new, open and closed documents, and keep track of your RCCA documents by problem type, location, severity, and more.
Create the chart widget
Add a widget
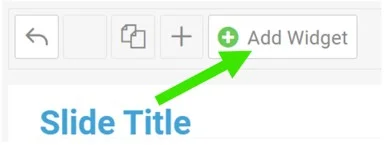
In your report, click Add Widget.
Select the chart
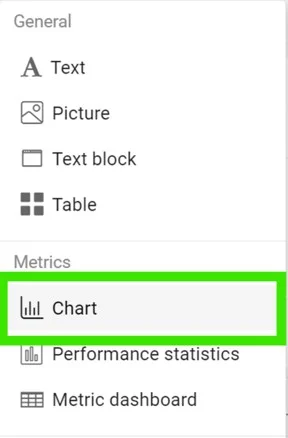
Select Chart from the submenu.
Add a data series
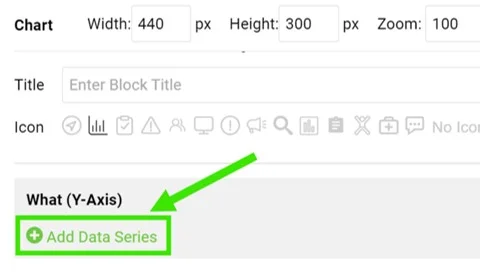
Click Add Data Series.
Select the data source
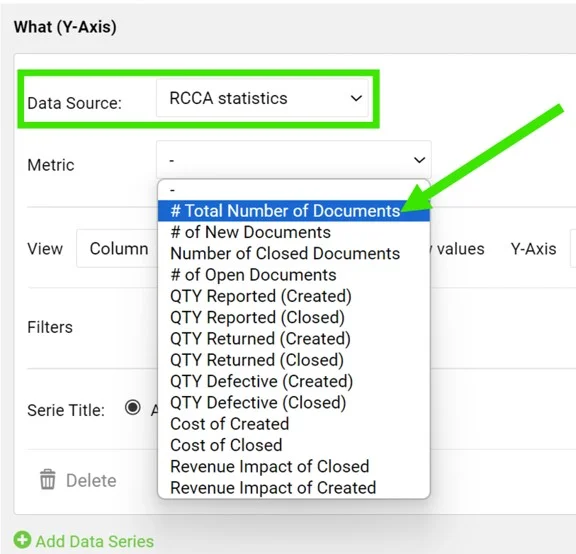
Select RCCA statistics as the data source and choose your metric.
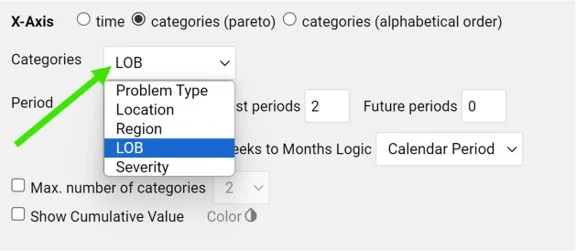
Define the categories
Define the categories, the time period and other settings.
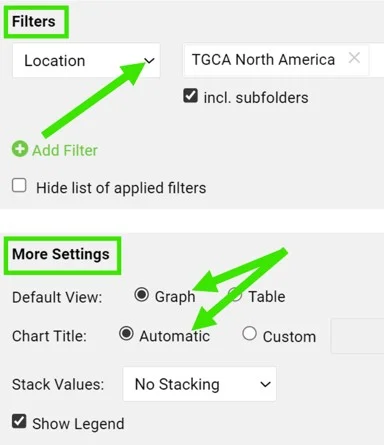
Set filters and the view
You can also set up additional filters (e.g. location, metric, RCCA template, etc.) and the view, title and legend in the More Settings section.
View the statistics
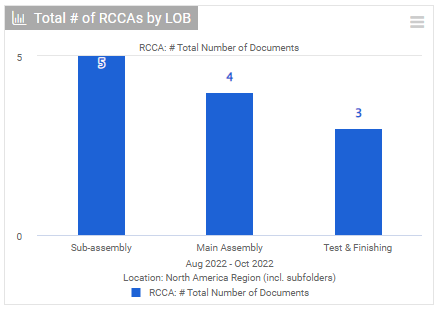
View your charts
View your charts in the report.
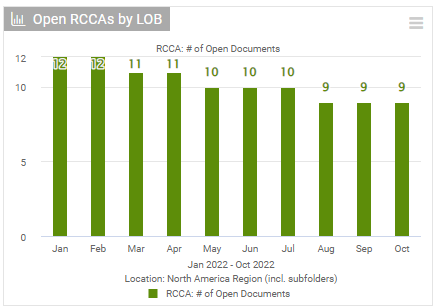
Track development over time
You can also view the development of your RCCA documents over a specific time period.
Please follow this link to learn more about setting up your reports.
Conecte sus documentos RCCA con el módulo Informes, donde puede crear distintos tipos de estadísticas. Siga el número total de documentos y los nuevos, abiertos y cerrados, y analice sus documentos RCCA por tipo de problema, ubicación, gravedad y más.
Crear el widget de gráfico
Agregar un widget
En su informe, haga clic en Agregar widget.
Seleccionar el gráfico
Seleccione Gráfico en el submenú.
Agregar una serie de datos
Haga clic en Agregar serie de datos.
Seleccionar la fuente de datos
Seleccione Estadísticas de RCCA como fuente de datos y elija la métrica.
Definir las categorías
Defina las categorías, el periodo y el resto de la configuración.
Definir los filtros y la vista
En la sección Más configuración también puede definir filtros adicionales (por ejemplo, ubicación, métrica, plantilla de RCCA, etc.), así como la vista, el título y la leyenda.
Ver las estadísticas
Ver los gráficos
Vea los gráficos en el informe.
Seguir la evolución en el tiempo
También puede ver la evolución de sus documentos RCCA en un periodo concreto.
Siga este enlace para saber más sobre cómo configurar sus informes.
¿Necesita más ayuda?
Escríbanos. En días laborables solemos responder en menos de una hora.