Project Metrics in your Action list
You can track project metrics directly in your action list.
Set up the project metrics
Open the action list settings
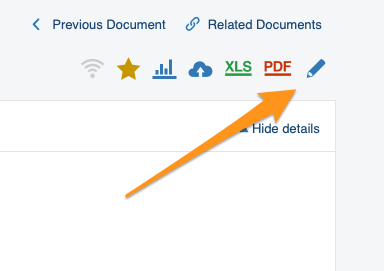
Go to your action list settings: click the edit pencil in the upper right corner above your action list.
Define the settings
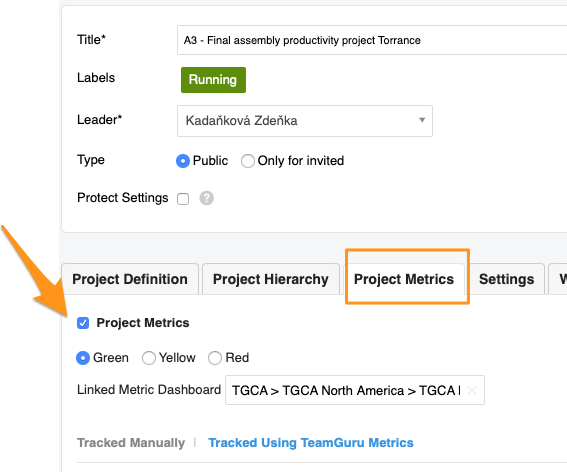
Go to the Project Metrics tab and define your settings. Choose the status color and, if needed, add a link to your metric dashboard.
Choose how to track the metrics
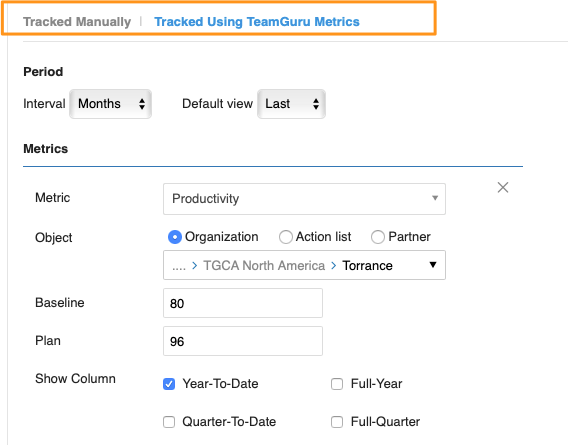
You can track metrics manually or with TeamGuru metrics (the metric values are then displayed here automatically). You can use both options at the same time. Please note that Baseline and Plan are manually entered, optional fields. Select the rest of the settings: period, metrics, org. unit, etc.
See the metrics in the action list
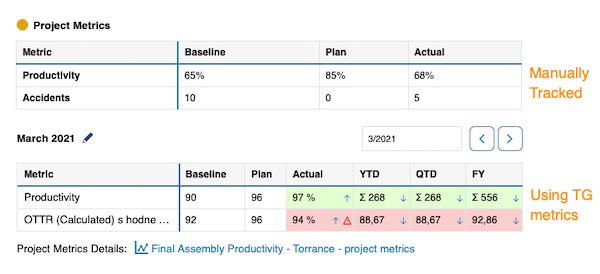
Once your project metrics are set up, the action list shows a metric table (for manually tracked metrics) or a mini dashboard (for TeamGuru metrics).
Work with TeamGuru metrics
Browse the metric history
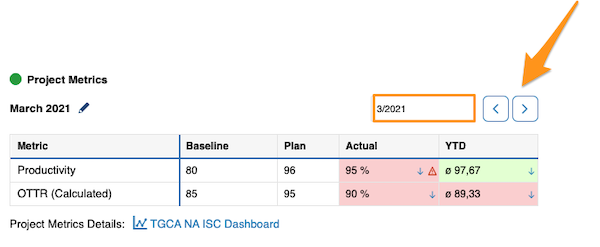
TeamGuru metrics let you collect metric values over time and track their history. Use the left or right arrow to view a different time period.
Display trend graphs
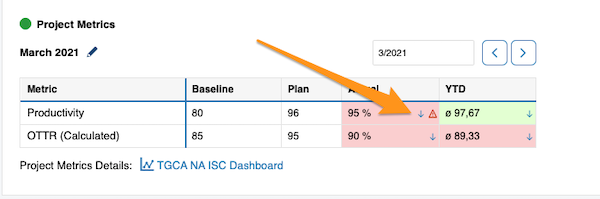
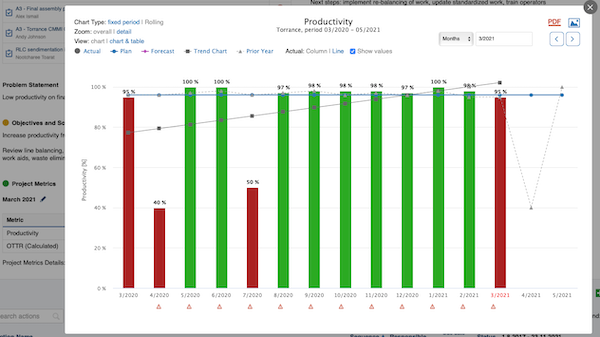
Click the blue arrow right next to a value to display its trend graph.
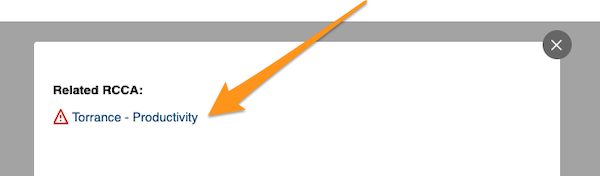
Open related RCCA documents
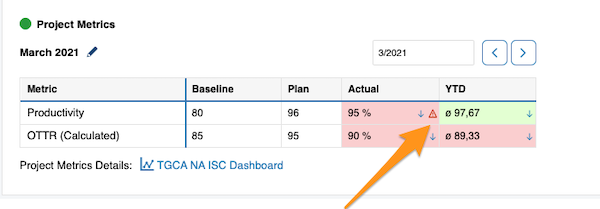
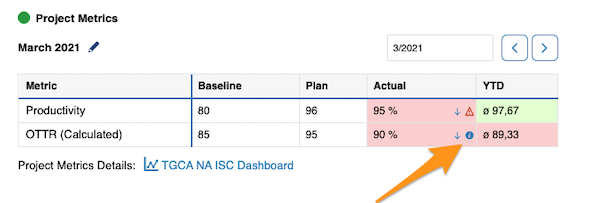
Live metrics also show related RCCA documents and comments. Click the red triangle to use a live link to your RCCA document.
View comments
Click the blue “i” icon to view your comments.
TeamGuru metrics can be collected in the Metric Dashboards module and are then displayed in your project automatically.
Metric values can also be entered in your action list only. These values are then stored in the TeamGuru database, so you can build a metric dashboard from them at any time in the future.
If the values are collected both in a metric dashboard and in the action list, changes are automatically reflected in both documents.
Still need help?
Write to us. We usually reply within an hour on business days.