Wskaźniki projektu na liście działań
Tłumaczenie maszynowe z angielskiego. Wyświetlany jest oryginał po angielsku.
You can track project metrics directly in your action list.
Set up the project metrics
Open the action list settings
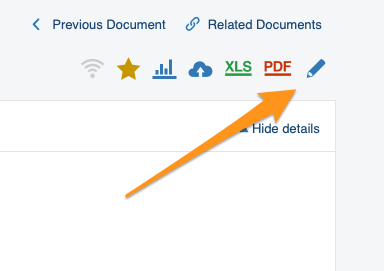
Go to your action list settings: click the edit pencil in the upper right corner above your action list.
Define the settings
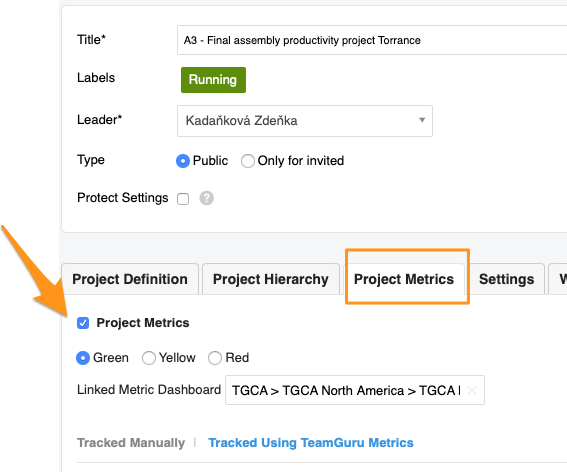
Go to the Project Metrics tab and define your settings. Choose the status color and, if needed, add a link to your metric dashboard.
Choose how to track the metrics
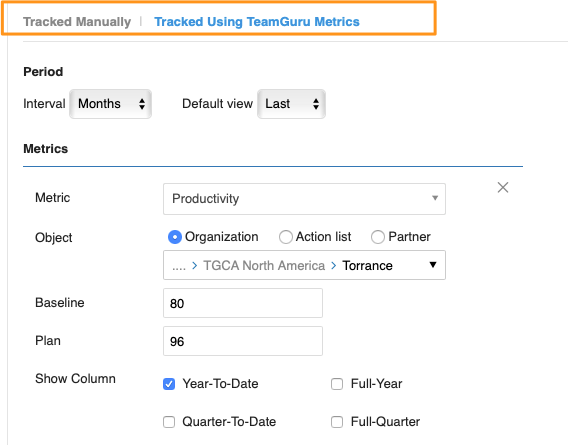
You can track metrics manually or with TeamGuru metrics (the metric values are then displayed here automatically). You can use both options at the same time. Please note that Baseline and Plan are manually entered, optional fields. Select the rest of the settings: period, metrics, org. unit, etc.
See the metrics in the action list
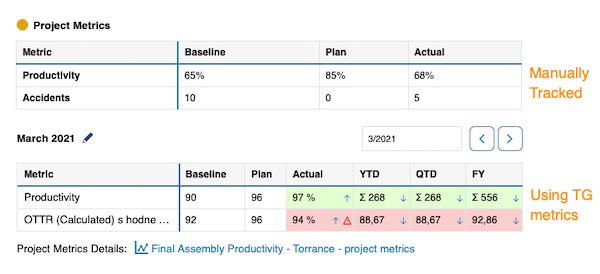
Once your project metrics are set up, the action list shows a metric table (for manually tracked metrics) or a mini dashboard (for TeamGuru metrics).
Work with TeamGuru metrics
Browse the metric history
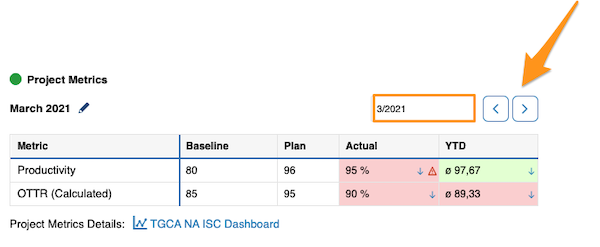
TeamGuru metrics let you collect metric values over time and track their history. Use the left or right arrow to view a different time period.
Display trend graphs
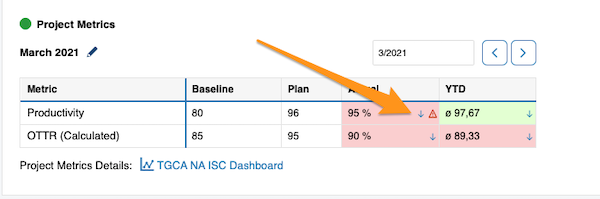
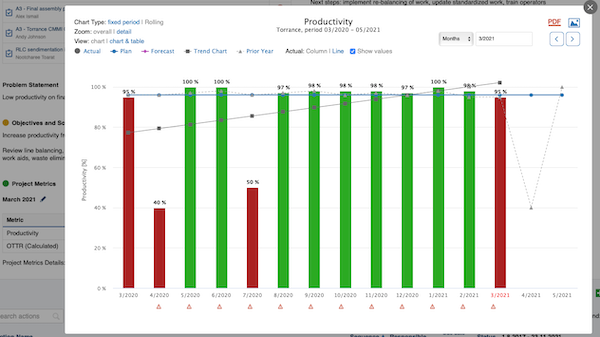
Click the blue arrow right next to a value to display its trend graph.
Open related RCCA documents
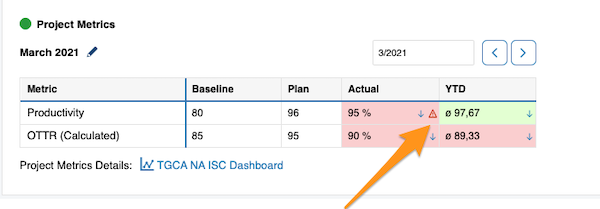
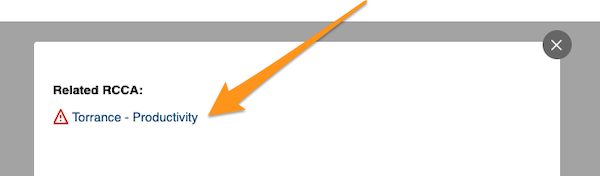
Live metrics also show related RCCA documents and comments. Click the red triangle to use a live link to your RCCA document.
View comments
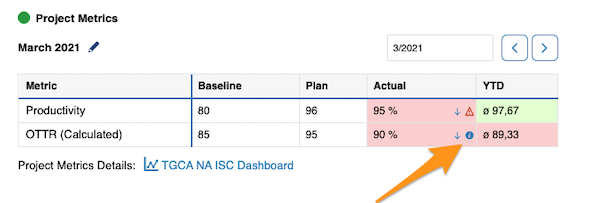
Click the blue “i” icon to view your comments.
TeamGuru metrics can be collected in the Metric Dashboards module and are then displayed in your project automatically.
Metric values can also be entered in your action list only. These values are then stored in the TeamGuru database, so you can build a metric dashboard from them at any time in the future.
If the values are collected both in a metric dashboard and in the action list, changes are automatically reflected in both documents.
Wskaźniki projektu możesz śledzić bezpośrednio na liście działań.
Ustaw wskaźniki projektu
Otwórz ustawienia listy działań
Przejdź do ustawień listy działań: kliknij ołówek edycji w prawym górnym rogu nad listą działań.
Określ ustawienia
Przejdź na kartę Wskaźniki projektu i określ ustawienia. Wybierz kolor statusu i w razie potrzeby dodaj link do dashboardu KPI.
Wybierz sposób śledzenia wskaźników
Wskaźniki możesz śledzić ręcznie albo za pomocą wskaźników TeamGuru (ich wartości pojawiają się wtedy tutaj automatycznie). Oba sposoby możesz łączyć. Pola Poziom bazowy i Plan wypełnia się ręcznie i są opcjonalne. Wybierz pozostałe ustawienia: okres, wskaźniki, jednostkę org. itd.
Zobacz wskaźniki na liście działań
Po ustawieniu wskaźników projektu lista działań pokazuje tabelę wskaźników (dla wskaźników śledzonych ręcznie) albo mini dashboard (dla wskaźników TeamGuru).
Pracuj ze wskaźnikami TeamGuru
Przeglądaj historię wskaźnika
Wskaźniki TeamGuru zbierają wartości w czasie, dzięki czemu możesz śledzić ich historię. Strzałką w lewo lub w prawo przełączysz się na inny okres.
Wyświetl wykresy trendu
Kliknij niebieską strzałkę tuż obok wartości, aby wyświetlić jej wykres trendu.
Otwórz powiązane dokumenty RCCA
Wskaźniki na żywo pokazują też powiązane dokumenty RCCA i komentarze. Kliknij czerwony trójkąt, aby przejść aktywnym linkiem do dokumentu RCCA.
Wyświetl komentarze
Kliknij niebieską ikonę „i”, aby zobaczyć komentarze.
Wskaźniki TeamGuru można zbierać w module Dashboardy KPI, a w projekcie pojawiają się one automatycznie.
Wartości wskaźników możesz też wpisywać tylko na liście działań. Zapisują się one w bazie danych TeamGuru, więc w każdej chwili możesz zbudować z nich dashboard KPI.
Jeśli wartości są zbierane zarówno w dashboardzie KPI, jak i na liście działań, zmiany automatycznie pojawiają się w obu dokumentach.
Potrzebujesz dalszej pomocy?
Napisz do nas. W dni robocze zwykle odpowiadamy w ciągu godziny.