行动清单中的项目指标
本文由英文机器翻译。 当前显示英文原文。
You can track project metrics directly in your action list.
Set up the project metrics
Open the action list settings
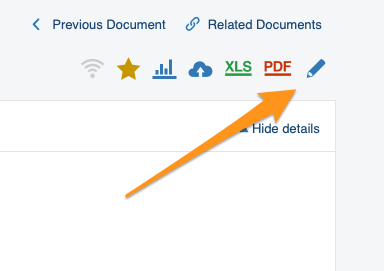
Go to your action list settings: click the edit pencil in the upper right corner above your action list.
Define the settings
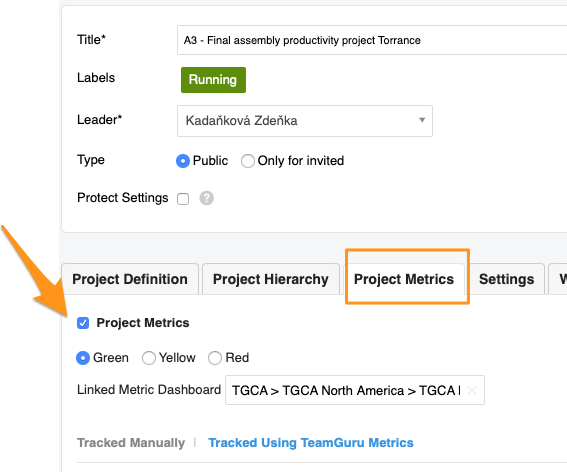
Go to the Project Metrics tab and define your settings. Choose the status color and, if needed, add a link to your metric dashboard.
Choose how to track the metrics
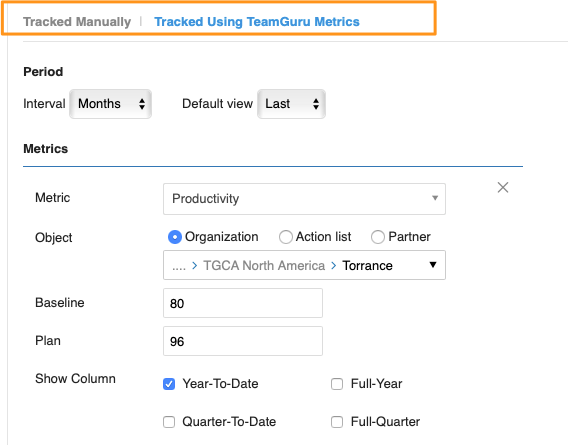
You can track metrics manually or with TeamGuru metrics (the metric values are then displayed here automatically). You can use both options at the same time. Please note that Baseline and Plan are manually entered, optional fields. Select the rest of the settings: period, metrics, org. unit, etc.
See the metrics in the action list
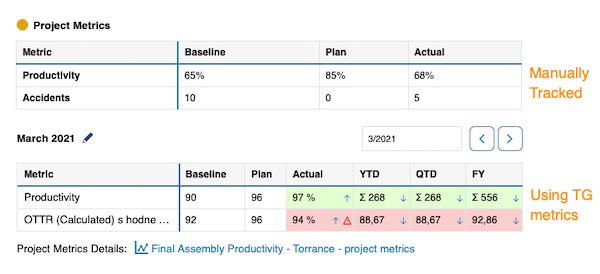
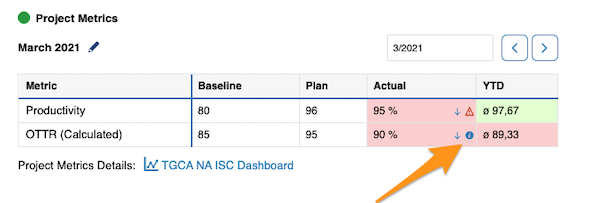
Once your project metrics are set up, the action list shows a metric table (for manually tracked metrics) or a mini dashboard (for TeamGuru metrics).
Work with TeamGuru metrics
Browse the metric history
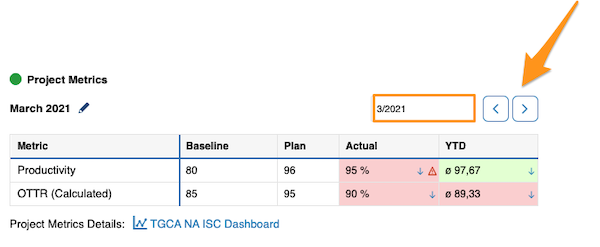
TeamGuru metrics let you collect metric values over time and track their history. Use the left or right arrow to view a different time period.
Display trend graphs
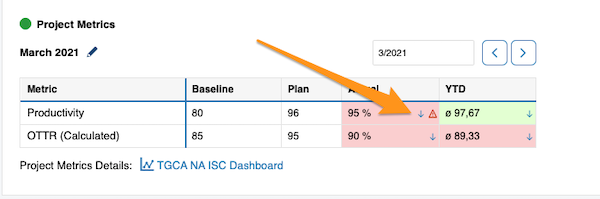
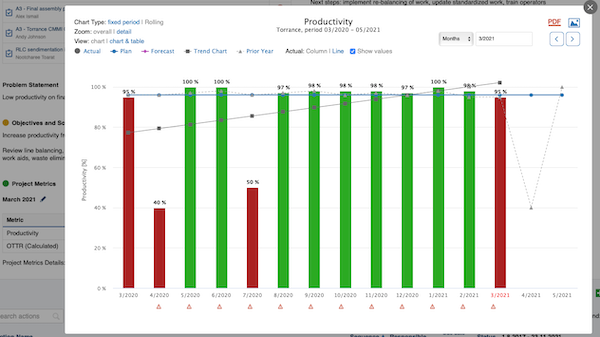
Click the blue arrow right next to a value to display its trend graph.
Open related RCCA documents
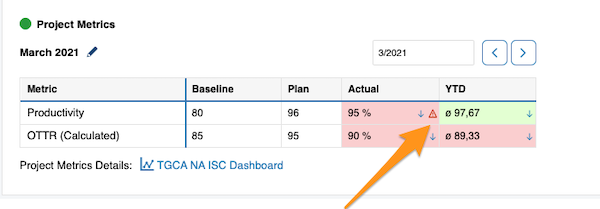
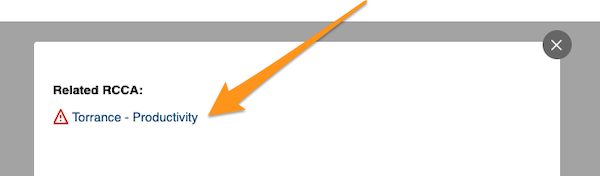
Live metrics also show related RCCA documents and comments. Click the red triangle to use a live link to your RCCA document.
View comments
Click the blue “i” icon to view your comments.
TeamGuru metrics can be collected in the Metric Dashboards module and are then displayed in your project automatically.
Metric values can also be entered in your action list only. These values are then stored in the TeamGuru database, so you can build a metric dashboard from them at any time in the future.
If the values are collected both in a metric dashboard and in the action list, changes are automatically reflected in both documents.
您可以直接在行动清单中跟踪项目指标。
设置项目指标
打开行动清单设置
进入行动清单设置:点击行动清单上方右上角的编辑铅笔图标。
定义设置
进入项目指标选项卡,定义设置。选择状态颜色,如有需要,添加指向指标仪表板的链接。
选择指标跟踪方式
您可以手动跟踪指标,也可以使用TeamGuru指标跟踪(指标值会自动显示在这里)。两种方式可以同时使用。请注意,基准和计划是手动输入的可选字段。再选择其余设置:期间、指标、组织单元等。
在行动清单中查看指标
设置好项目指标后,行动清单会显示指标表(手动跟踪的指标)或迷你仪表板(TeamGuru指标)。
使用TeamGuru指标
浏览指标历史
使用TeamGuru指标,可以长期收集指标值并跟踪其历史。使用左右箭头查看其他时间期间。
显示趋势图
点击数值右侧的蓝色箭头,显示其趋势图。
打开相关RCCA文档
实时指标还会显示相关的RCCA文档和评论。点击红色三角形,即可通过实时链接打开RCCA文档。
查看评论
点击蓝色“i”图标查看评论。
TeamGuru指标可以在指标仪表板模块中收集,然后自动显示在项目中。
指标值也可以只在行动清单中输入。这些值会存储在TeamGuru数据库中,因此您今后随时可以用它们创建指标仪表板。
如果同时在指标仪表板和行动清单中收集数值,更改会自动同步到这两个文档中。
还需要帮助吗?
请给我们留言。工作日我们通常会在一小时内回复。