Projektové metriky v akčnom zozname
Strojový preklad z angličtiny. Zobrazený je anglický originál.
You can track project metrics directly in your action list.
Set up the project metrics
Open the action list settings
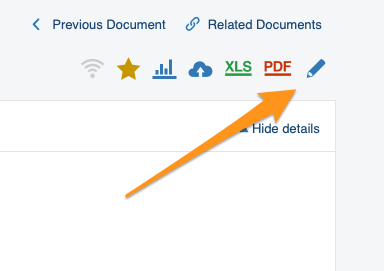
Go to your action list settings: click the edit pencil in the upper right corner above your action list.
Define the settings
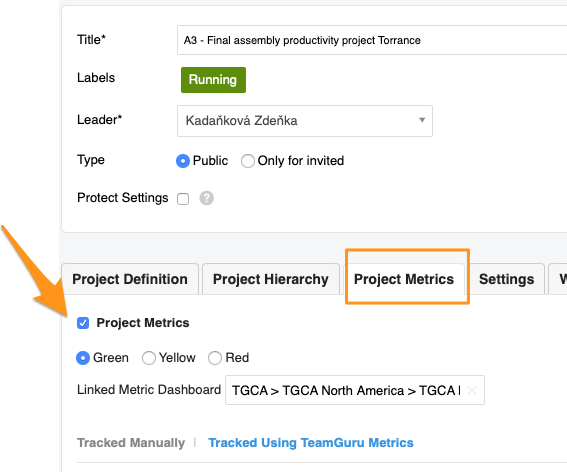
Go to the Project Metrics tab and define your settings. Choose the status color and, if needed, add a link to your metric dashboard.
Choose how to track the metrics
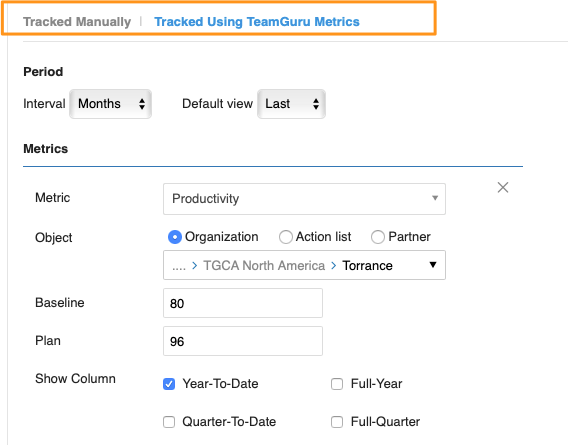
You can track metrics manually or with TeamGuru metrics (the metric values are then displayed here automatically). You can use both options at the same time. Please note that Baseline and Plan are manually entered, optional fields. Select the rest of the settings: period, metrics, org. unit, etc.
See the metrics in the action list
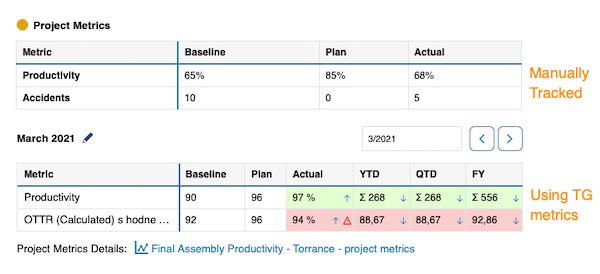
Once your project metrics are set up, the action list shows a metric table (for manually tracked metrics) or a mini dashboard (for TeamGuru metrics).
Work with TeamGuru metrics
Browse the metric history
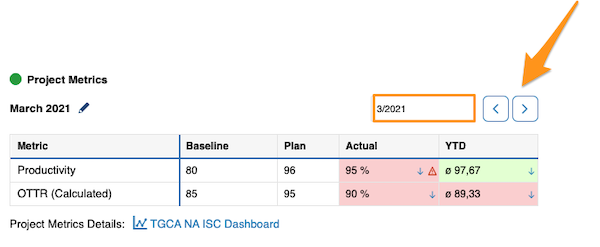
TeamGuru metrics let you collect metric values over time and track their history. Use the left or right arrow to view a different time period.
Display trend graphs
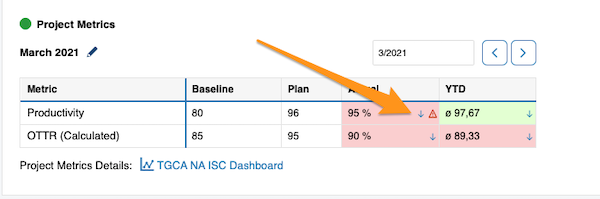
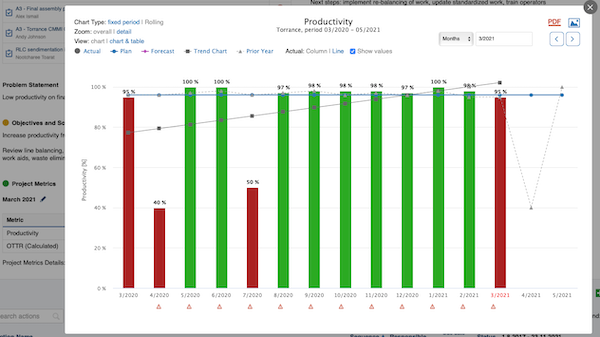
Click the blue arrow right next to a value to display its trend graph.
Open related RCCA documents
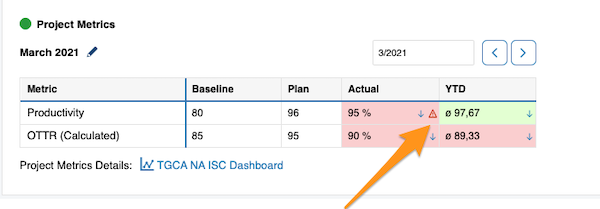
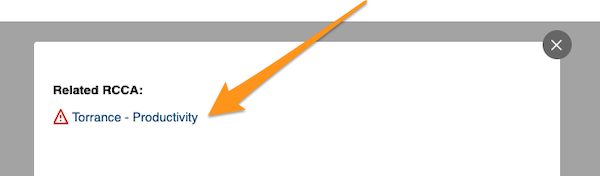
Live metrics also show related RCCA documents and comments. Click the red triangle to use a live link to your RCCA document.
View comments
Click the blue “i” icon to view your comments.
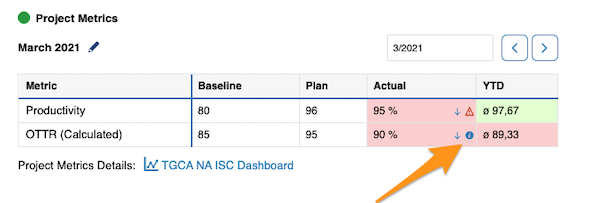
TeamGuru metrics can be collected in the Metric Dashboards module and are then displayed in your project automatically.
Metric values can also be entered in your action list only. These values are then stored in the TeamGuru database, so you can build a metric dashboard from them at any time in the future.
If the values are collected both in a metric dashboard and in the action list, changes are automatically reflected in both documents.
Projektové metriky môžete sledovať priamo v akčnom zozname.
Nastavenie projektových metrík
Otvorte nastavenia akčného zoznamu
Otvorte nastavenia akčného zoznamu: kliknite na ceruzku v pravom hornom rohu nad akčným zoznamom.
Určte nastavenia
Prejdite na kartu Projektové metriky a určte nastavenia. Vyberte farbu stavu a podľa potreby pridajte odkaz na KPI dashboard.
Zvoľte spôsob sledovania metrík
Metriky môžete sledovať ručne alebo cez metriky TeamGuru (ich hodnoty sa tu potom zobrazujú automaticky). Obe možnosti môžete používať súčasne. Polia Východisková hodnota a Plán sú nepovinné a vypĺňajú sa ručne. Vyberte ostatné nastavenia: obdobie, metriky, org. jednotku atď.
Pozrite si metriky v akčnom zozname
Po nastavení projektových metrík sa v akčnom zozname zobrazí tabuľka metrík (pri ručne sledovaných metrikách) alebo mini dashboard (pri metrikách TeamGuru).
Práca s metrikami TeamGuru
Prezrite si históriu metriky
Metriky TeamGuru zbierajú hodnoty v čase, takže môžete sledovať ich históriu. Šípkou doľava alebo doprava zobrazíte iné obdobie.
Zobrazte graf trendu
Kliknutím na modrú šípku hneď vedľa hodnoty zobrazíte jej graf trendu.
Otvorte súvisiace dokumenty RCCA
Živé metriky zobrazujú aj súvisiace dokumenty RCCA a komentáre. Kliknutím na červený trojuholník sa cez živý odkaz dostanete do dokumentu RCCA.
Pozrite si komentáre
Komentáre zobrazíte kliknutím na modrú ikonu „i“.
Metriky TeamGuru môžete zbierať v module KPI dashboardy a v projekte sa potom zobrazujú automaticky.
Hodnoty metrík môžete zadávať aj len v akčnom zozname. Uložia sa do databázy TeamGuru, takže z nich môžete kedykoľvek neskôr vytvoriť KPI dashboard.
Ak sa hodnoty zbierajú v KPI dashboarde aj v akčnom zozname, zmeny sa automaticky prejavia v oboch dokumentoch.
Potrebujete ďalšiu pomoc?
Napíšte nám. V pracovné dni zvyčajne odpovedáme do hodiny.