So legen Sie eine neue RCCA an und verknüpfen sie mit einer Kennzahl
Maschinelle Übersetzung aus dem Englischen. Englisches Original wird angezeigt.
You can create a root cause analysis (RCCA) report and link it to a particular metric dashboard.
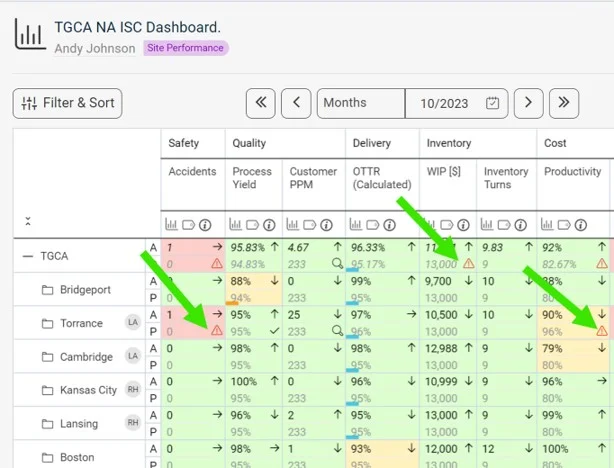
See the RCCA icon in the dashboard
Once the RCCA document is linked to a certain metric/unit combination, the RCCA icon is displayed in the dashboard, as shown below.
Create the RCCA document
-
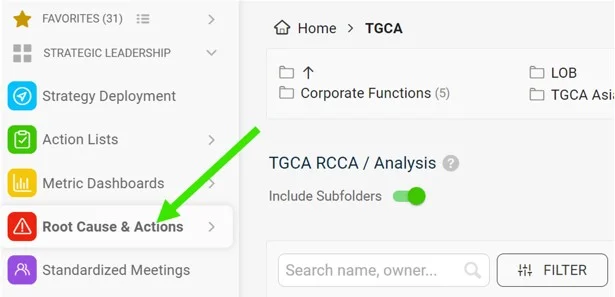
Open the Root Cause & Actions module. Go to the Root Cause & Actions module on the left-hand side of the screen.
-
Click Create New. Click Create New on the right side of the screen.
-
Add a title and choose the type. Add a title and choose the type of RCCA.
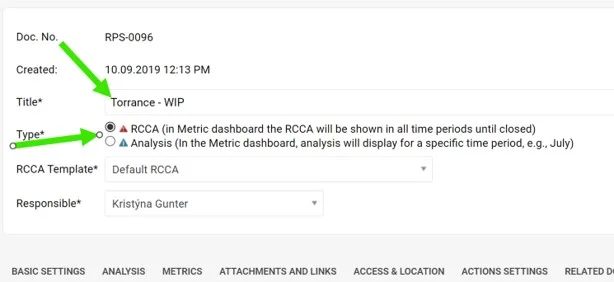
There are two types of RCCA. The only difference is how long the RCCA icon (a triangle) is displayed in the metric dashboard, if it is a metric-related RCCA document. The red RCCA (1st option) displays the red triangle icon in the dashboard the whole time until the RCCA document is closed. The blue RCCA (2nd option) displays the blue triangle icon in the metric dashboard only for the default period of the metric dashboard (e.g. in a weekly dashboard only for the week, in a monthly dashboard only for the month in which the RCCA document was created).
-
Select the RCCA template.
-
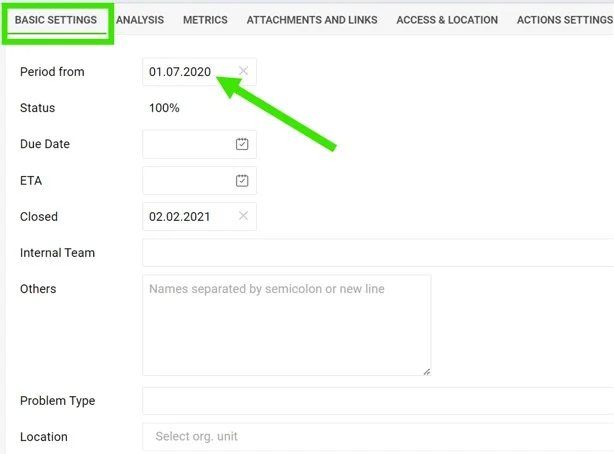
Fill in the details. Fill in the details under each of the tabs. In Basic Settings, it is important to fill in the Period from which the RCCA icon will be displayed in the metric dashboard (if the RCCA document is metric-related).
-
Fill in the analysis. The analysis and Pareto charts can be filled in on the 2nd tab, Analysis.
-
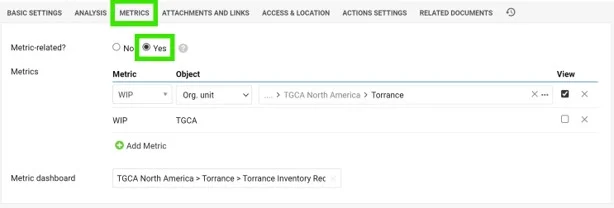
Link the metric. To link the RCCA document to a certain metric/unit combination, set it up under the 3rd tab, Metrics. Here you can also link a particular metric dashboard.
Video guide: creating a new RCCA
Sie können einen Bericht zur Ursachenanalyse (RCCA) anlegen und mit einem bestimmten KPI-Dashboard verknüpfen.
RCCA-Symbol im Dashboard
Sobald das RCCA-Dokument mit einer bestimmten Kombination aus Kennzahl und Einheit verknüpft ist, erscheint im Dashboard das RCCA-Symbol, wie unten gezeigt.
RCCA-Dokument anlegen
-
Öffnen Sie das Modul Ursachenanalyse und Maßnahmen. Öffnen Sie links auf dem Bildschirm das Modul Ursachenanalyse und Maßnahmen.
-
Klicken Sie auf Neu erstellen. Klicken Sie rechts auf dem Bildschirm auf Neu erstellen.
-
Geben Sie einen Titel ein und wählen Sie den Typ. Geben Sie einen Titel ein und wählen Sie den RCCA-Typ.
Es gibt zwei RCCA-Typen. Sie unterscheiden sich nur darin, wie lange das RCCA-Symbol (ein Dreieck) im KPI-Dashboard angezeigt wird, wenn sich das RCCA-Dokument auf eine Kennzahl bezieht. Die rote RCCA (1. Option) zeigt das rote Dreieck im Dashboard so lange an, bis das RCCA-Dokument geschlossen wird. Die blaue RCCA (2. Option) zeigt das blaue Dreieck im KPI-Dashboard nur für den Standardzeitraum des Dashboards an (z. B. in einem Wochen-Dashboard nur für die Woche, in einem Monats-Dashboard nur für den Monat, in dem das RCCA-Dokument angelegt wurde).
-
Wählen Sie die RCCA-Vorlage.
-
Füllen Sie die Details aus. Füllen Sie die Details auf den einzelnen Registerkarten aus. In den Grundeinstellungen ist der Zeitraum wichtig, ab dem das RCCA-Symbol im KPI-Dashboard angezeigt wird (wenn sich das RCCA-Dokument auf eine Kennzahl bezieht).
-
Füllen Sie die Analyse aus. Analyse und Pareto-Diagramme füllen Sie auf der 2. Registerkarte Analyse aus.
-
Verknüpfen Sie die Kennzahl. Die Verknüpfung des RCCA-Dokuments mit einer bestimmten Kombination aus Kennzahl und Einheit richten Sie auf der 3. Registerkarte Kennzahlen ein. Hier können Sie auch ein bestimmtes KPI-Dashboard verknüpfen.
Video-Anleitung: neue RCCA anlegen
Brauchen Sie weitere Hilfe?
Schreiben Sie uns. An Werktagen antworten wir meist innerhalb einer Stunde.