Jak utworzyć nowe RCCA i powiązać je z konkretnym wskaźnikiem
Tłumaczenie maszynowe z angielskiego. Wyświetlany jest oryginał po angielsku.
You can create a root cause analysis (RCCA) report and link it to a particular metric dashboard.
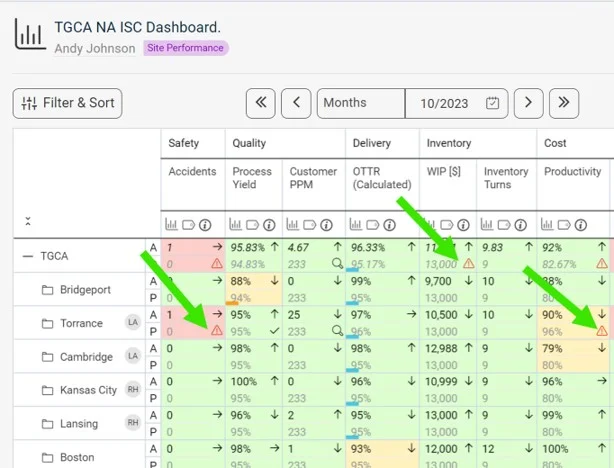
See the RCCA icon in the dashboard
Once the RCCA document is linked to a certain metric/unit combination, the RCCA icon is displayed in the dashboard, as shown below.
Create the RCCA document
-
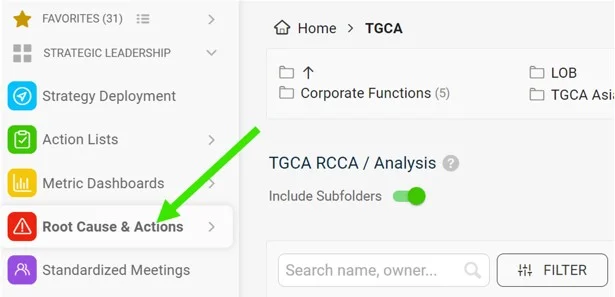
Open the Root Cause & Actions module. Go to the Root Cause & Actions module on the left-hand side of the screen.
-
Click Create New. Click Create New on the right side of the screen.
-
Add a title and choose the type. Add a title and choose the type of RCCA.
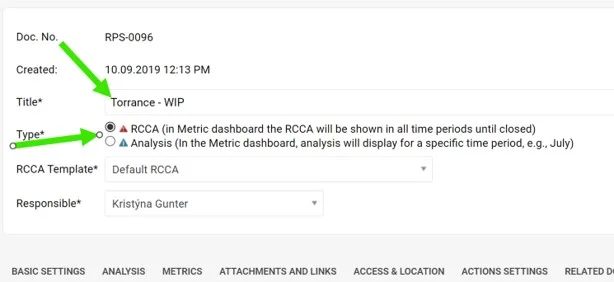
There are two types of RCCA. The only difference is how long the RCCA icon (a triangle) is displayed in the metric dashboard, if it is a metric-related RCCA document. The red RCCA (1st option) displays the red triangle icon in the dashboard the whole time until the RCCA document is closed. The blue RCCA (2nd option) displays the blue triangle icon in the metric dashboard only for the default period of the metric dashboard (e.g. in a weekly dashboard only for the week, in a monthly dashboard only for the month in which the RCCA document was created).
-
Select the RCCA template.
-
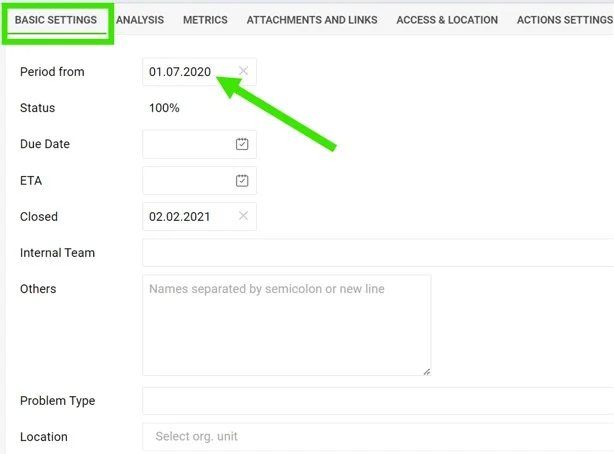
Fill in the details. Fill in the details under each of the tabs. In Basic Settings, it is important to fill in the Period from which the RCCA icon will be displayed in the metric dashboard (if the RCCA document is metric-related).
-
Fill in the analysis. The analysis and Pareto charts can be filled in on the 2nd tab, Analysis.
-
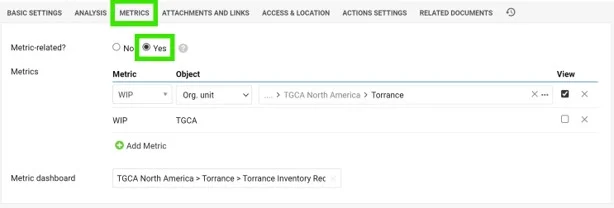
Link the metric. To link the RCCA document to a certain metric/unit combination, set it up under the 3rd tab, Metrics. Here you can also link a particular metric dashboard.
Video guide: creating a new RCCA
Możesz utworzyć raport analizy przyczyn źródłowych (RCCA) i powiązać go z konkretnym dashboardem KPI.
Ikona RCCA w dashboardzie
Gdy dokument RCCA jest powiązany z konkretną parą wskaźnik/jednostka, w dashboardzie pojawia się ikona RCCA, jak poniżej.
Utwórz dokument RCCA
-
Otwórz moduł Analiza przyczyn i działania korygujące. Przejdź do modułu Analiza przyczyn i działania korygujące w menu po lewej stronie ekranu.
-
Kliknij Utwórz nowy. Kliknij Utwórz nowy po prawej stronie ekranu.
-
Dodaj tytuł i wybierz typ. Wpisz tytuł i wybierz typ RCCA.
Są dwa typy RCCA. Różnią się tylko tym, jak długo ikona RCCA (trójkąt) jest widoczna w dashboardzie KPI, jeśli dokument RCCA dotyczy wskaźnika. Czerwone RCCA (1. opcja) pokazuje w dashboardzie czerwony trójkąt przez cały czas, aż do zamknięcia dokumentu RCCA. Niebieskie RCCA (2. opcja) pokazuje niebieski trójkąt w dashboardzie KPI tylko w domyślnym okresie dashboardu (np. w dashboardzie tygodniowym tylko w tym tygodniu, a w miesięcznym tylko w tym miesiącu, w którym utworzono dokument RCCA).
-
Wybierz szablon RCCA.
-
Uzupełnij szczegóły. Wypełnij pola na każdej karcie. W Ustawieniach podstawowych koniecznie podaj Okres, od którego ikona RCCA ma być widoczna w dashboardzie KPI (jeśli dokument RCCA dotyczy wskaźnika).
-
Wypełnij analizę. Analizę i wykresy Pareto uzupełnisz na 2. karcie, Analiza.
-
Powiąż wskaźnik. Aby powiązać dokument RCCA z konkretną parą wskaźnik/jednostka, ustaw to na 3. karcie, Wskaźniki. Tu możesz też powiązać konkretny dashboard KPI.
Wideo: tworzenie nowego RCCA
Potrzebujesz dalszej pomocy?
Napisz do nas. W dni robocze zwykle odpowiadamy w ciągu godziny.