So arbeiten Sie mit den Ansichten Strategieplan und Säulen
Maschinelle Übersetzung aus dem Englischen. Englisches Original wird angezeigt.
The same plan can be shown in three ways. Switch between them with the tabs above the main objective:
- X-matrix – the classic matrix with all links.
- Strategic Plan – a table that follows each 5-year goal down to its annual goals, priorities, projects and KPIs.
- Pillars – one box per pillar, with the goals, priorities and KPIs of that pillar under each other.
All three tabs show the same data. Change an item in one of them and it changes in the others.
Strategic Plan
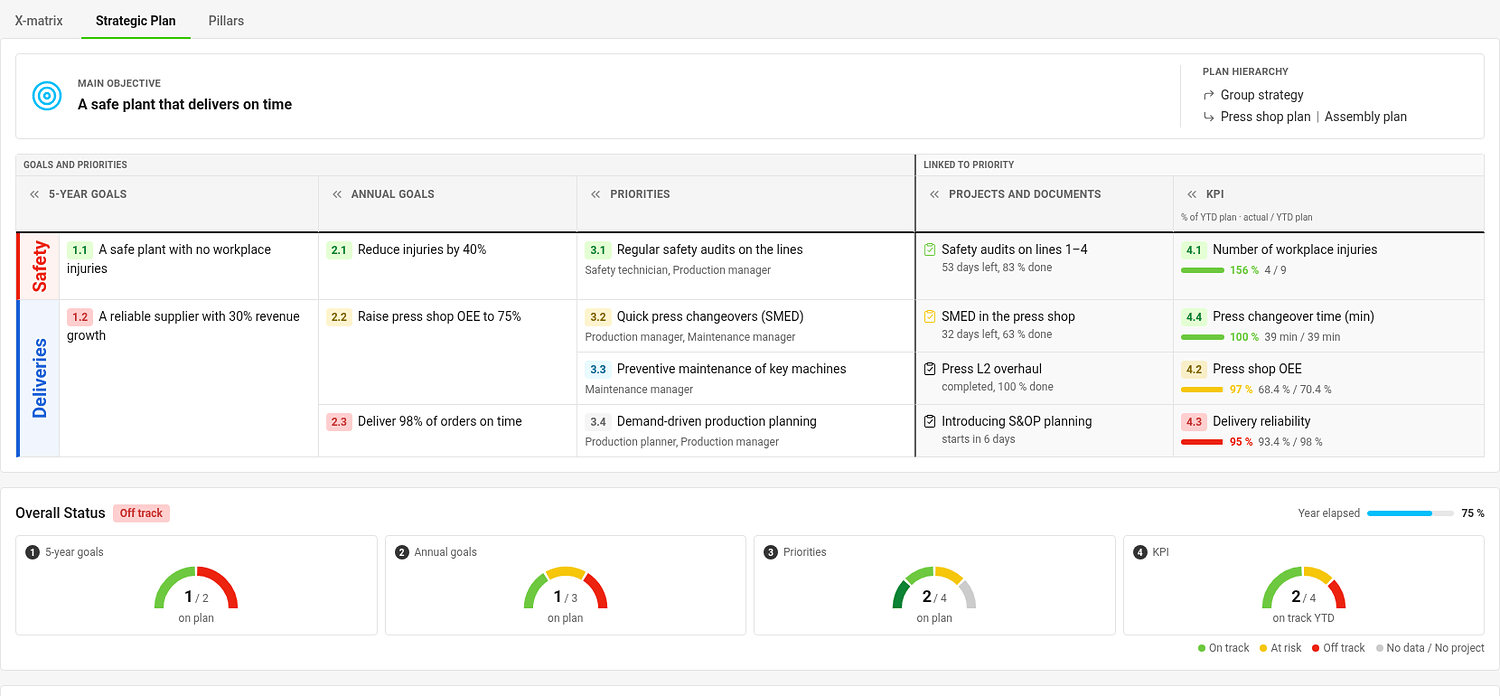
The table has one column for each list: 5-year goals, annual goals, priorities, Projects and documents and KPIs. A colored strip on the left names the pillar of each band of rows. Every goal starts a group of rows with the items that support it; an item linked under several parents appears under each of them.
Each cell shows the code, the title and the status of the item, the responsible people of goals and priorities, the linked projects of a priority and the YTD result of a KPI. Click « in a column header to narrow the column.
To edit the table, click Edit strategic plan. Click a title to rename it, use the + next to an item to add a follow-up item already linked under it, and the handle to change the order. Save with Done.
Pillars
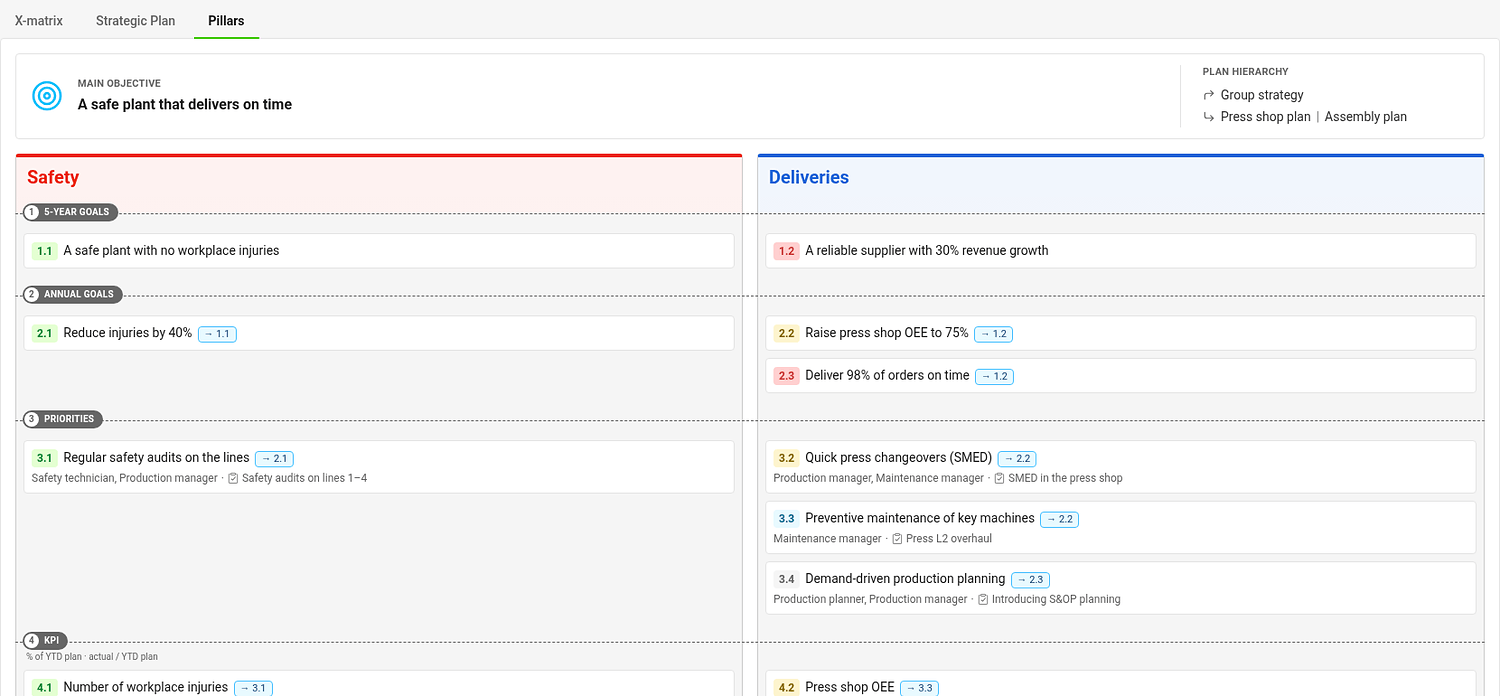
Pillars group your plan by theme, for example Safety, Quality, Growth and People. Each pillar is a box; the levels run across the boxes as rows. A card shows the code, the title, the item it supports (for example → 1.1), the people responsible and the first project.
- An item belongs to a pillar if it carries that pillar’s tag. A goal or priority without a pillar tag inherits the pillars of the items above it, and a KPI inherits from the priorities it measures.
- An item in more than one pillar appears in each of them.
- Items without any pillar are in the box Unassigned.
- If the plan does not use pillars, everything is in one box called All items. Pillars are optional.
Each pillar box is edited on its own – click Edit in its header, make your changes and click Done. Add pillar adds a pillar to the plan.
Choose the pillars of a plan
Pillars are tags of the type Pillars. Choose which ones a plan uses in Settings → Basic settings → Pillars; the order you choose is the order of the boxes. If you choose none, the plan uses the first tag of each 5-year goal.
Choose which tab opens first
In Settings → Basic settings → Default View pick X-matrix, Strategic Plan or Pillars. A link with ?view= in the address always opens the tab it names.
Derselbe Plan lässt sich auf drei Arten anzeigen. Sie wechseln über die Registerkarten über dem Hauptziel:
- X-Matrix – die klassische Matrix mit allen Verknüpfungen.
- Strategieplan – eine Tabelle, die jedes 5-Jahres-Ziel bis zu seinen Jahreszielen, Prioritäten, Projekten und KPIs verfolgt.
- Säulen – ein Feld je Säule, darin untereinander die Ziele, Prioritäten und KPIs dieser Säule.
Alle drei Registerkarten zeigen dieselben Daten. Ändern Sie ein Element in einer Ansicht, ändert es sich auch in den anderen.
Strategieplan
Die Tabelle hat für jede Liste eine Spalte: 5-Jahres-Ziele, Jahresziele, Prioritäten, Projekte und Dokumente und KPIs. Ein farbiger Streifen links nennt die Säule jedes Zeilenblocks. Jedes Ziel beginnt eine Zeilengruppe mit den Elementen, die es unterstützen; ein Element, das unter mehreren übergeordneten Elementen verknüpft ist, erscheint unter jedem davon.
Jede Zelle zeigt Code, Titel und Status des Elements, die Verantwortlichen von Zielen und Prioritäten, die verknüpften Projekte einer Priorität und das YTD-Ergebnis eines KPI. Mit « im Spaltenkopf machen Sie die Spalte schmaler.
Zum Bearbeiten der Tabelle klicken Sie auf Strategieplan bearbeiten. Klicken Sie auf einen Titel, um ihn umzubenennen, nutzen Sie + neben einem Element, um ein direkt darunter verknüpftes Folgeelement hinzuzufügen, und den Ziehgriff, um die Reihenfolge zu ändern. Speichern Sie mit Fertig.
Säulen
Säulen gruppieren Ihren Plan nach Themen, zum Beispiel Sicherheit, Qualität, Wachstum und Mitarbeiter. Jede Säule ist ein Feld; die Ebenen verlaufen als Zeilen quer über die Felder. Eine Karte zeigt Code, Titel, das unterstützte Element (zum Beispiel → 1.1), die Verantwortlichen und das erste Projekt.
- Ein Element gehört zu einer Säule, wenn es deren Tag trägt. Ein Ziel oder eine Priorität ohne Säulen-Tag übernimmt die Säulen der übergeordneten Elemente, ein KPI die der Prioritäten, die er misst.
- Ein Element in mehreren Säulen erscheint in jeder davon.
- Elemente ohne Säule stehen im Feld Nicht zugeordnet.
- Nutzt der Plan keine Säulen, steht alles in einem Feld namens Alle Elemente. Säulen sind optional.
Jedes Säulenfeld wird einzeln bearbeitet – klicken Sie in seinem Kopf auf Bearbeiten, nehmen Sie Ihre Änderungen vor und klicken Sie auf Fertig. Säule hinzufügen fügt dem Plan eine Säule hinzu.
Säulen eines Plans wählen
Säulen sind Tags vom Typ Säulen. Welche ein Plan nutzt, wählen Sie unter Einstellungen → Grundeinstellungen → Säulen; die gewählte Reihenfolge ist die Reihenfolge der Felder. Wählen Sie keine, nutzt der Plan den ersten Tag jedes 5-Jahres-Ziels.
Festlegen, welche Registerkarte zuerst öffnet
Wählen Sie unter Einstellungen → Grundeinstellungen → Standardansicht X-Matrix, Strategieplan oder Säulen. Ein Link mit ?view= in der Adresse öffnet immer die darin genannte Registerkarte.
Brauchen Sie weitere Hilfe?
Schreiben Sie uns. An Werktagen antworten wir meist innerhalb einer Stunde.