How to set up metric color coding
Metric color coding in your dashboard can be set up in several ways, based on your preference. You need a sufficient role to edit metric settings.
Open the color settings
Open the metric settings
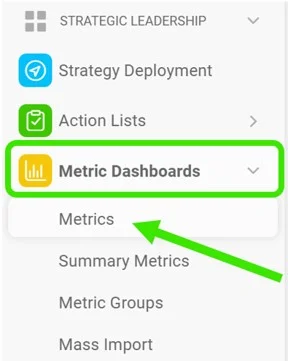
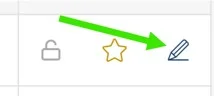
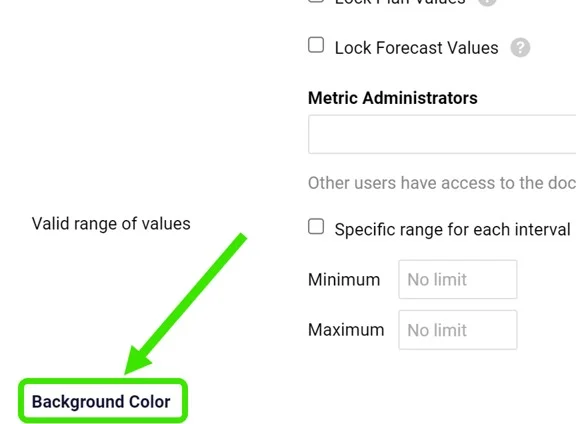
Go to Metrics, click the edit pencil next to your metric and customize the Background Color section.
Choose the metric type
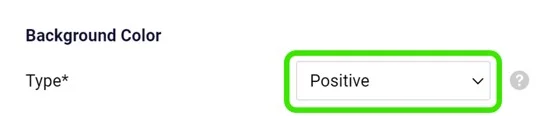
Choose the Type: Positive or Negative. The type drives the automatic color coding. Use Positive for metrics where it is good to be above the plan (e.g. revenue), and Negative for the opposite.
Select the color coding mode
Select the Color Coding Mode. The options are described below.
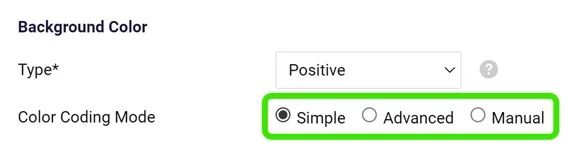
Color coding modes
Simple mode
With the Simple option, your metric is color-coded based on the Type you selected and on the Color Coding Priority (forecast or plan).
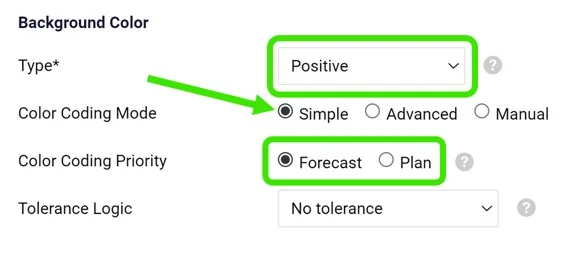
Color coding is displayed only if both the plan (or forecast) and the actual values are entered. You choose only the priority: if the priority value (e.g. forecast) is not entered but the plan value is, the color is based on the plan value.
Amber tolerance
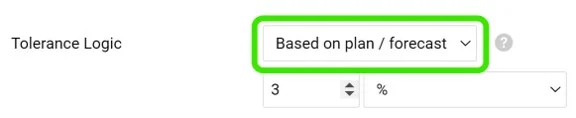
In simple mode, you can also set up amber color coding in the Tolerance Logic field. If the actual value is worse than the target but within the defined interval, the cell is displayed in amber instead of red.
Advanced mode
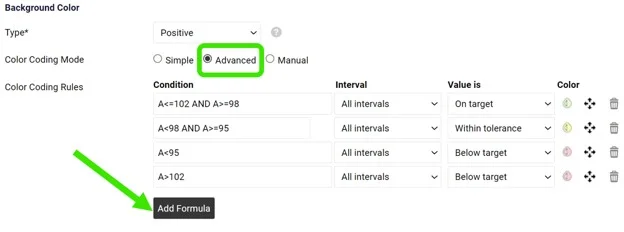
With the Advanced option, you can customize your Color Coding Rules. With this option, the plan or forecast values do not need to be entered.
Set up your Condition (add the formulas needed), Intervals, Value is and Color.
Please contact us if you need any assistance setting it up.
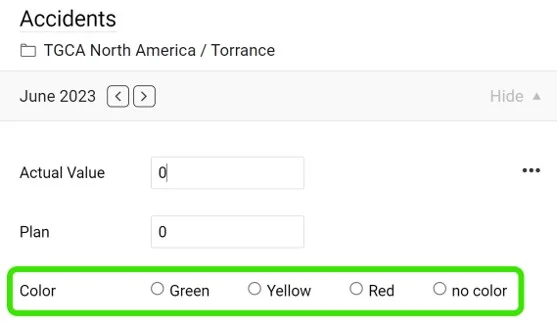
Manual mode
With the Manual option, you set up and modify the color manually, directly in your cell and its pop-up window.
Customize colors per dashboard
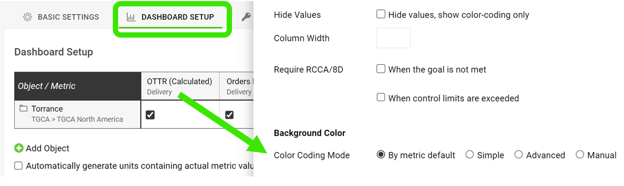
Customize the dashboard setup
The color coding and tolerance selected in your metric settings are applied and displayed by default in all dashboards where the metric is used.
However, you can also customize both directly in your dashboard or template if needed. If you customize them at the dashboard level, the setup applies only to that specific dashboard, or to all the dashboards included in the template.
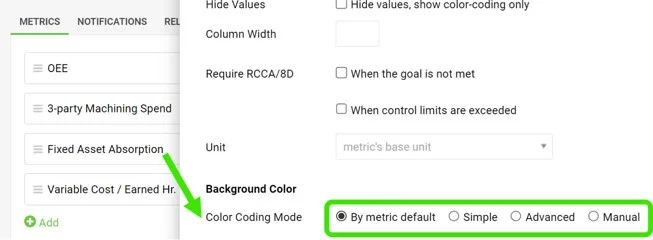
Customize the template setup
The same customization is available in the template setup.
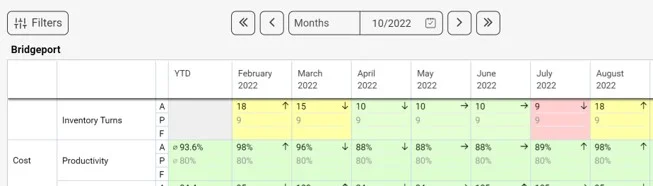
View the colored cells
Once your color coding preference is set up, the cell background is colored accordingly.
Still need help?
Write to us. We usually reply within an hour on business days.