如何设置指标颜色标识
本文由英文机器翻译。 当前显示英文原文。
Metric color coding in your dashboard can be set up in several ways, based on your preference. You need a sufficient role to edit metric settings.
Open the color settings
Open the metric settings
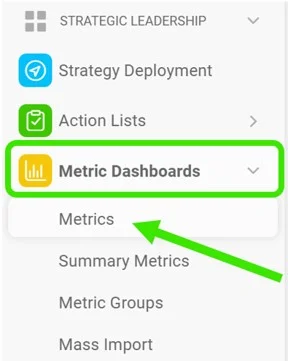
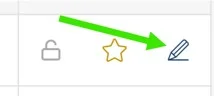
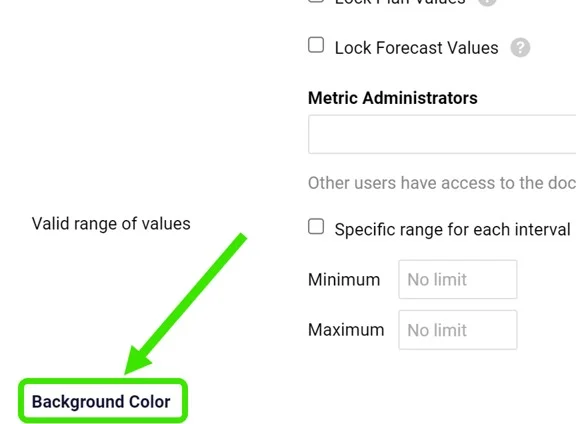
Go to Metrics, click the edit pencil next to your metric and customize the Background Color section.
Choose the metric type
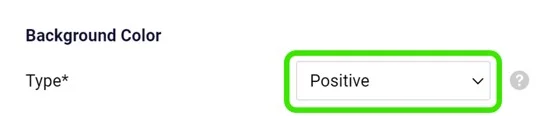
Choose the Type: Positive or Negative. The type drives the automatic color coding. Use Positive for metrics where it is good to be above the plan (e.g. revenue), and Negative for the opposite.
Select the color coding mode
Select the Color Coding Mode. The options are described below.
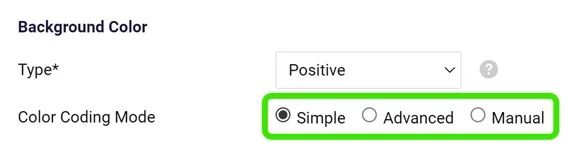
Color coding modes
Simple mode
With the Simple option, your metric is color-coded based on the Type you selected and on the Color Coding Priority (forecast or plan).
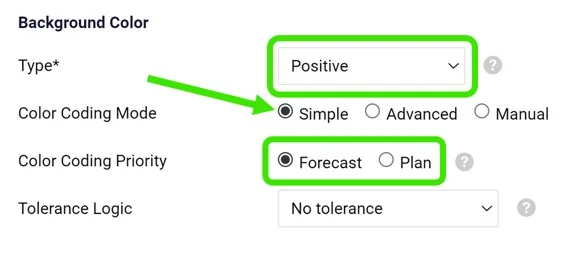
Color coding is displayed only if both the plan (or forecast) and the actual values are entered. You choose only the priority: if the priority value (e.g. forecast) is not entered but the plan value is, the color is based on the plan value.
Amber tolerance
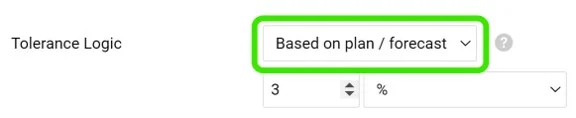
In simple mode, you can also set up amber color coding in the Tolerance Logic field. If the actual value is worse than the target but within the defined interval, the cell is displayed in amber instead of red.
Advanced mode
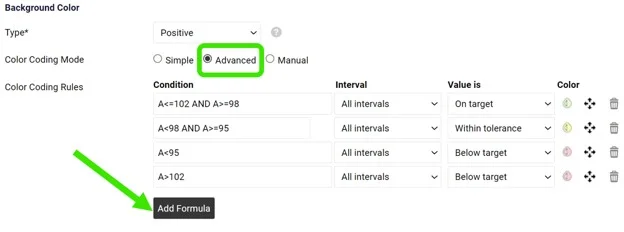
With the Advanced option, you can customize your Color Coding Rules. With this option, the plan or forecast values do not need to be entered.
Set up your Condition (add the formulas needed), Intervals, Value is and Color.
Please contact us if you need any assistance setting it up.
Manual mode
With the Manual option, you set up and modify the color manually, directly in your cell and its pop-up window.
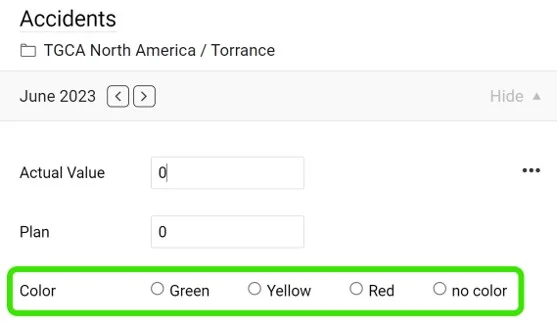
Customize colors per dashboard
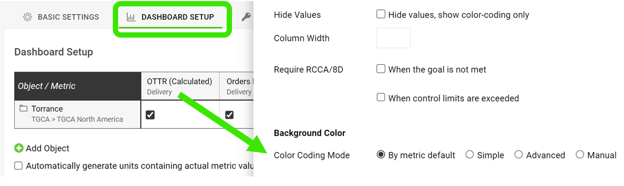
Customize the dashboard setup
The color coding and tolerance selected in your metric settings are applied and displayed by default in all dashboards where the metric is used.
However, you can also customize both directly in your dashboard or template if needed. If you customize them at the dashboard level, the setup applies only to that specific dashboard, or to all the dashboards included in the template.
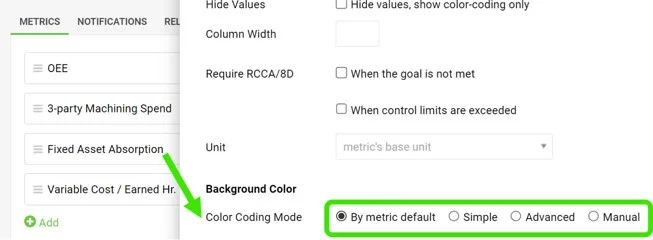
Customize the template setup
The same customization is available in the template setup.
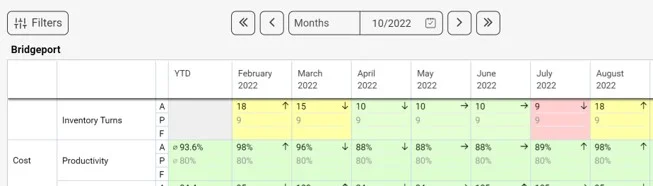
View the colored cells
Once your color coding preference is set up, the cell background is colored accordingly.
仪表板中的指标颜色标识可以根据您的偏好,通过多种方式设置。编辑指标设置需要具备相应的角色。
打开颜色设置
打开指标设置
进入指标,点击指标旁的编辑铅笔图标,然后自定义背景色部分。
选择指标类型
选择类型:正向或负向。类型决定了自动颜色标识。对于高于计划为好的指标(例如收入),请使用正向;反之则使用负向。
选择颜色标识模式
选择颜色标识模式。各选项说明如下。
颜色标识模式
简单模式
选择简单选项后,指标会根据所选类型和颜色标识优先级(预测值或计划值)进行颜色标识。
只有同时输入了计划值(或预测值)和实际值,才会显示颜色标识。 您只需选择优先级:如果未输入优先值(例如预测值)但输入了计划值,颜色将根据计划值确定。
琥珀色容差
在简单模式下,您还可以在容差逻辑字段中设置琥珀色标识。如果实际值未达到目标,但仍在定义的区间内,单元格会显示为琥珀色,而不是红色。
高级模式
选择高级选项后,可以自定义颜色标识规则。使用此选项时,无需输入计划值或预测值。
设置条件(添加所需公式)、区间、数值为和颜色。
如果在设置时需要任何帮助,请联系我们。
手动模式
选择手动选项后,可以直接在单元格及其弹出窗口中手动设置和修改颜色。
按仪表板自定义颜色
自定义仪表板设置
指标设置中选择的颜色标识和容差,默认应用并显示在使用该指标的所有仪表板中。
但如有需要,您也可以直接在仪表板或模板中自定义这两项。如果在仪表板层级自定义,设置只适用于该仪表板,或该模板包含的所有仪表板。
自定义模板设置
模板设置中也提供相同的自定义选项。
查看着色的单元格
设置好颜色标识偏好后,单元格背景会相应着色。
还需要帮助吗?
请给我们留言。工作日我们通常会在一小时内回复。