Jak ustawić kolorowanie wskaźników
Tłumaczenie maszynowe z angielskiego. Wyświetlany jest oryginał po angielsku.
Metric color coding in your dashboard can be set up in several ways, based on your preference. You need a sufficient role to edit metric settings.
Open the color settings
Open the metric settings
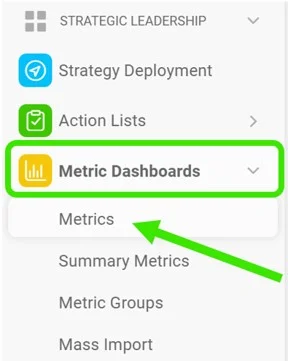
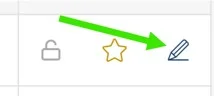
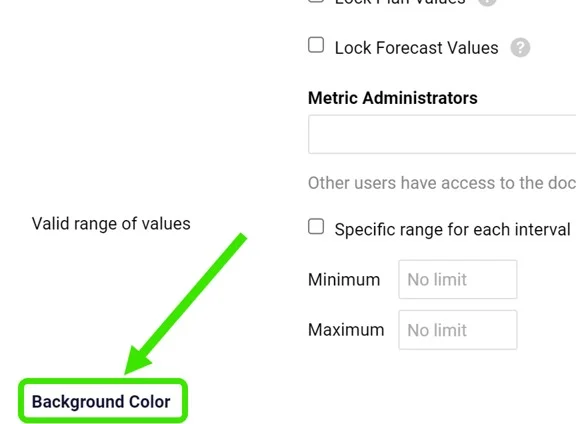
Go to Metrics, click the edit pencil next to your metric and customize the Background Color section.
Choose the metric type
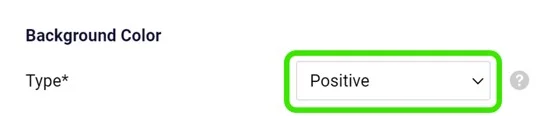
Choose the Type: Positive or Negative. The type drives the automatic color coding. Use Positive for metrics where it is good to be above the plan (e.g. revenue), and Negative for the opposite.
Select the color coding mode
Select the Color Coding Mode. The options are described below.
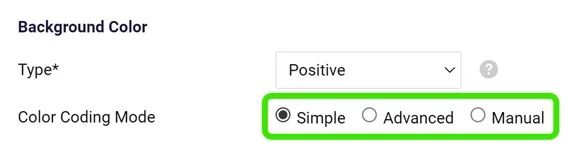
Color coding modes
Simple mode
With the Simple option, your metric is color-coded based on the Type you selected and on the Color Coding Priority (forecast or plan).
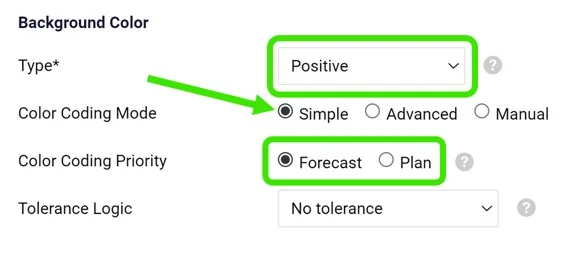
Color coding is displayed only if both the plan (or forecast) and the actual values are entered. You choose only the priority: if the priority value (e.g. forecast) is not entered but the plan value is, the color is based on the plan value.
Amber tolerance
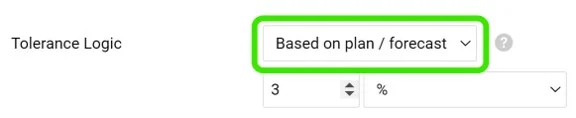
In simple mode, you can also set up amber color coding in the Tolerance Logic field. If the actual value is worse than the target but within the defined interval, the cell is displayed in amber instead of red.
Advanced mode
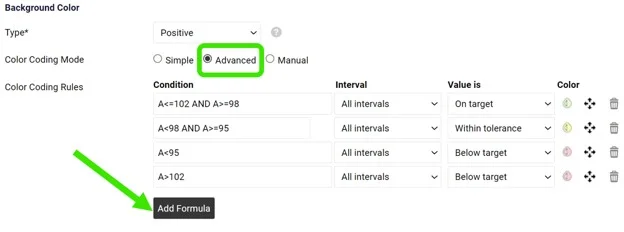
With the Advanced option, you can customize your Color Coding Rules. With this option, the plan or forecast values do not need to be entered.
Set up your Condition (add the formulas needed), Intervals, Value is and Color.
Please contact us if you need any assistance setting it up.
Manual mode
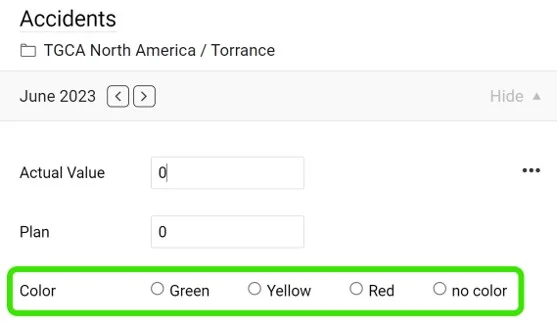
With the Manual option, you set up and modify the color manually, directly in your cell and its pop-up window.
Customize colors per dashboard
Customize the dashboard setup
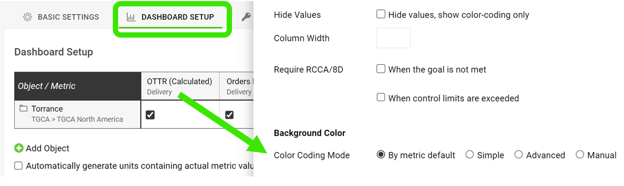
The color coding and tolerance selected in your metric settings are applied and displayed by default in all dashboards where the metric is used.
However, you can also customize both directly in your dashboard or template if needed. If you customize them at the dashboard level, the setup applies only to that specific dashboard, or to all the dashboards included in the template.
Customize the template setup
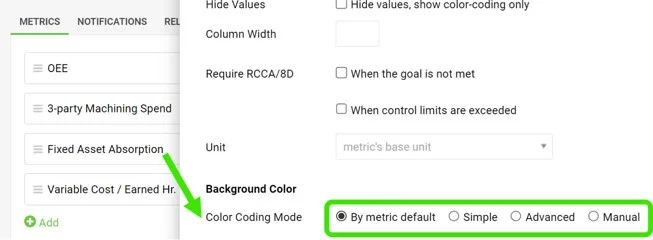
The same customization is available in the template setup.
View the colored cells
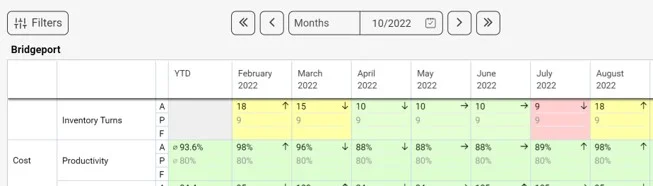
Once your color coding preference is set up, the cell background is colored accordingly.
Kolorowanie wskaźników w dashboardzie możesz ustawić na kilka sposobów, zależnie od potrzeb. Do edycji ustawień wskaźnika potrzebujesz odpowiedniej roli.
Otwórz ustawienia kolorów
Otwórz ustawienia wskaźnika
Przejdź do pozycji Wskaźniki, kliknij ołówek edycji obok wskaźnika i dostosuj sekcję Kolor tła.
Wybierz typ wskaźnika
Wybierz Typ: Pozytywny lub Negatywny. Od typu zależy automatyczne kolorowanie. Wybierz Pozytywny dla wskaźników, w których dobrze jest być powyżej planu (np. przychód), a Negatywny w odwrotnym przypadku.
Wybierz tryb kolorowania
Wybierz Tryb kolorowania. Poszczególne opcje opisujemy poniżej.
Tryby kolorowania
Tryb prosty
W opcji Prosty kolor wskaźnika zależy od wybranego Typu i od Priorytetu kolorowania (prognoza lub plan).
Kolorowanie pojawia się tylko wtedy, gdy wpisano zarówno plan (lub prognozę), jak i wartość rzeczywistą. Wybierasz tylko priorytet: jeśli wartość priorytetowa (np. prognoza) nie jest wpisana, a wartość planu jest, kolor zależy od planu.
Tolerancja na żółto
W trybie prostym możesz też ustawić kolor żółty w polu Logika tolerancji. Jeśli wartość rzeczywista jest gorsza od celu, ale mieści się w określonym przedziale, komórka zmieni kolor na żółty zamiast na czerwony.
Tryb zaawansowany
W opcji Zaawansowany możesz dostosować Reguły kolorowania. W tej opcji nie trzeba wpisywać wartości planu ani prognozy.
Ustaw Warunek (dodaj potrzebne formuły), Przedziały, Wartość jest i Kolor.
Jeśli potrzebujesz pomocy przy ustawianiu, skontaktuj się z nami.
Tryb ręczny
W opcji Ręczny ustawiasz i zmieniasz kolor ręcznie, bezpośrednio w komórce i jej oknie podręcznym.
Dostosuj kolory w dashboardzie
Dostosuj konfigurację dashboardu
Kolorowanie i tolerancja wybrane w ustawieniach wskaźnika domyślnie obowiązują we wszystkich dashboardach, w których używany jest wskaźnik.
W razie potrzeby możesz jednak dostosować oba ustawienia bezpośrednio w dashboardzie lub szablonie. Ustawienia na poziomie dashboardu dotyczą tylko tego konkretnego dashboardu, a w szablonie wszystkich dashboardów, które z niego powstały.
Dostosuj konfigurację szablonu
Te same zmiany możesz wprowadzić w konfiguracji szablonu.
Zobacz kolorowe komórki
Po ustawieniu kolorowania tło komórek zmienia kolor zgodnie z ustawieniami.
Potrzebujesz dalszej pomocy?
Napisz do nas. W dni robocze zwykle odpowiadamy w ciągu godziny.