Ustawienia zaawansowane (beta) wskaźnika w dashboardzie KPI
Tłumaczenie maszynowe z angielskiego. Wyświetlany jest oryginał po angielsku.
Customize your metric’s settings in the dashboard and add or display more columns and rows as you need. The general settings are described first, followed by two examples. This functionality helps you to:
- View calculated values without creating a new metric.
- Display project header information in project dashboards.
Metric settings in the dashboard
Open the dashboard settings
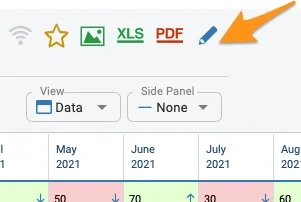
Go to your dashboard settings using the edit pencil.
Select the metric
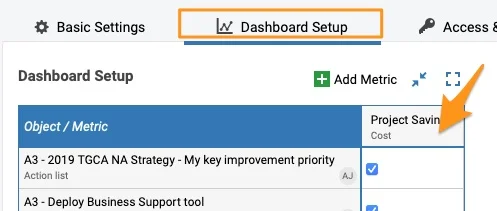
Select the Dashboard Setup tab and click the metric.
Choose a settings option
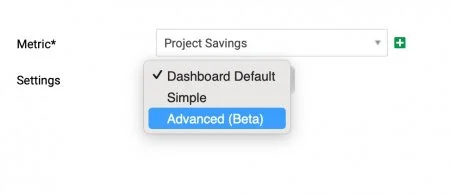
The submenu offers three settings options.
Dashboard Default
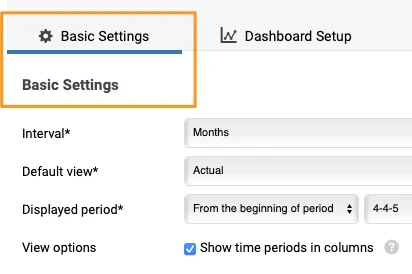
Dashboard Default is defined on the Basic Settings tab. It is the same setup for all metrics used in the dashboard, unless a metric is customized with the simple or advanced options.
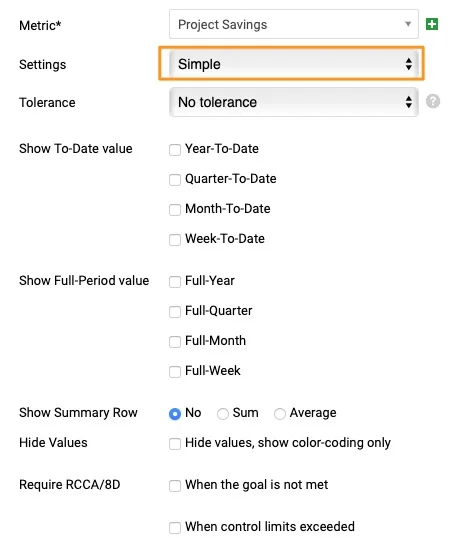
Simple
Simple settings let you set up specific fields of the metric differently than in the basic settings (e.g. different triggers for RCCA alerts for the metrics of your choice, other to-date values to show, etc.).
Advanced (Beta)
Advanced (Beta) lets you add metric rows and columns as you prefer (e.g. the status of your project, an extra calculation, etc.).
If you set up the Advanced (Beta) settings and then change them to Simple or Dashboard Default, all the advanced settings are removed.
Example 1: Calculated values
-
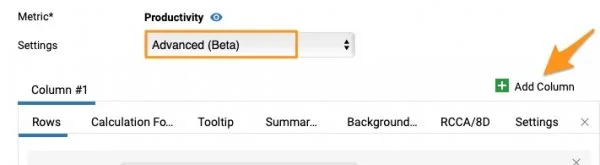
Add a column. Let’s say you want to calculate the Actual vs Plan value and display it as a column. Go to your metric in the dashboard settings, select the Advanced (Beta) settings and add a column by clicking the green plus button (Add Column).
-
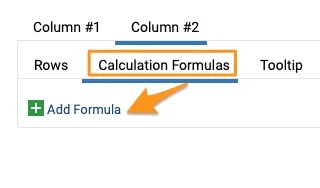
Add a formula. Your Column #2 is created (the active column is underlined). Go to the Calculation Formulas tab and click Add Formula.
-
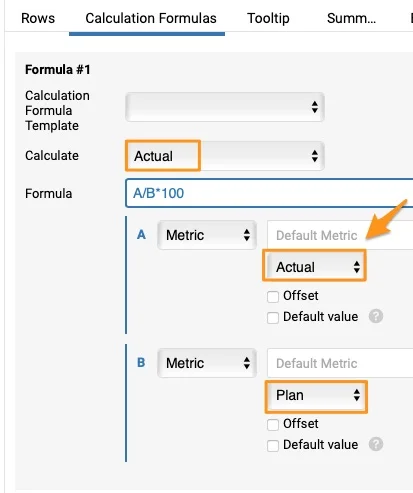
Define the formula. Select one of the preset formulas in the first field, Calculation Formula Template, or enter your own formula in the Formula field. To compare Actual values with Plan or Forecast, you must choose the Actual option in the Calculate field. The formula is set up automatically with a default metric, but you can change it if needed.
-
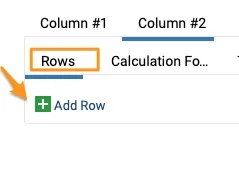
Add a row. Go to the Rows tab and add a row by clicking the green plus button (Add Row).
-
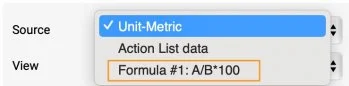
Select the formula as the source. Select your formula from the Source menu.
-
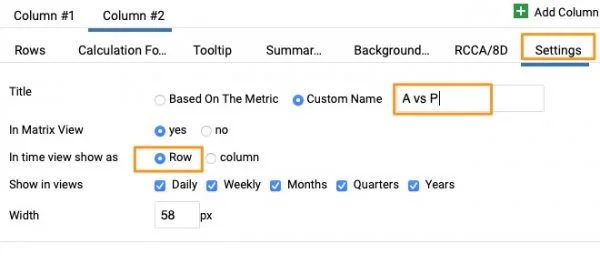
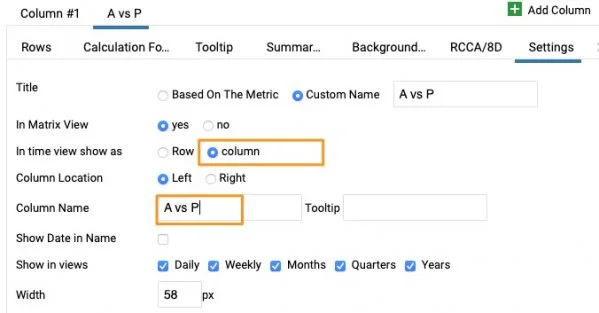
Define the display settings. Go to the Settings tab and define whether you want to see a row or a column, add a Custom name, choose Show in views, the width, etc.
-
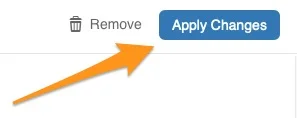
Apply the changes. When ready, click the Apply Changes button and save the dashboard settings.
-
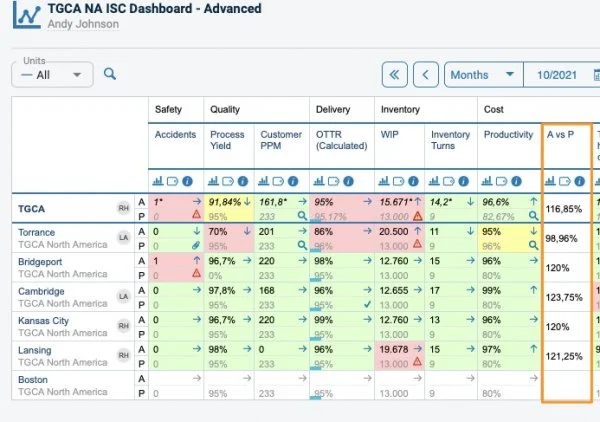
View the dashboard with several units. In a dashboard that includes several units, the calculated value is displayed like this.
-
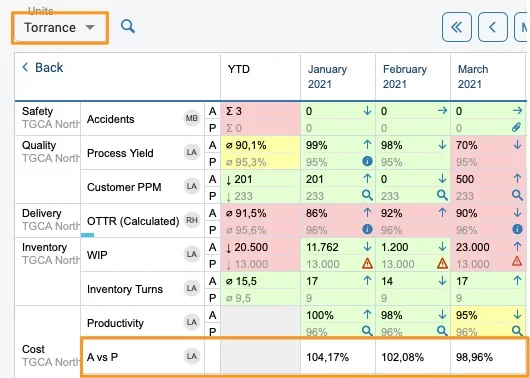
View a single site as a row. When you click a specific site, the value set up as a row is displayed like this.
-
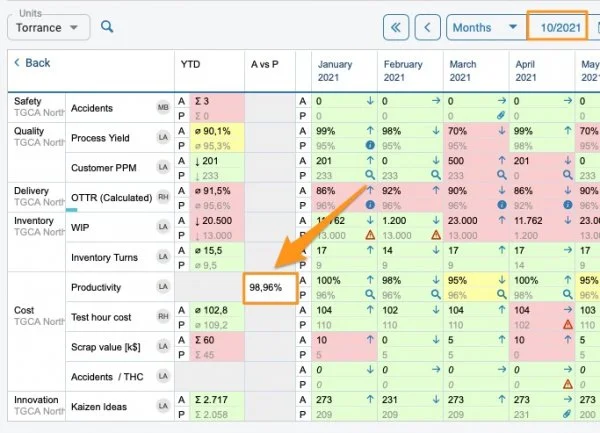
View a single site as a column. If you choose the column view in the settings, it is displayed like this. You have to give your column a different custom name.
Example 2: Display project header information
Use action list data as the source
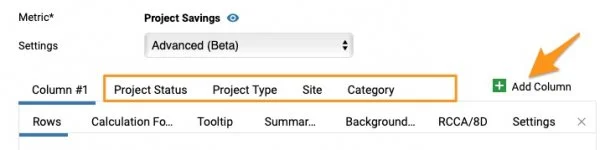
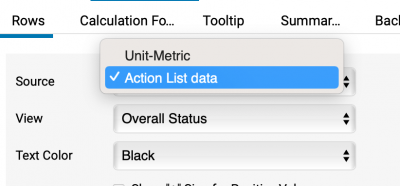
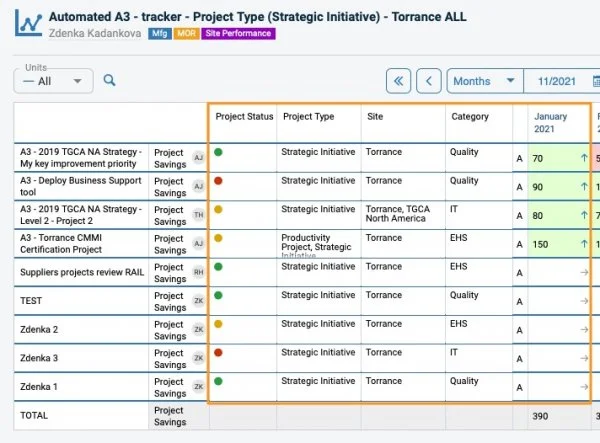
Follow the same process as above: add columns and set up each column with the rows you need. Then select Action List data as the Source. In the View field, choose what information from your project you want to see (e.g. Overall Status), and customize the name in the settings.
Other tabs
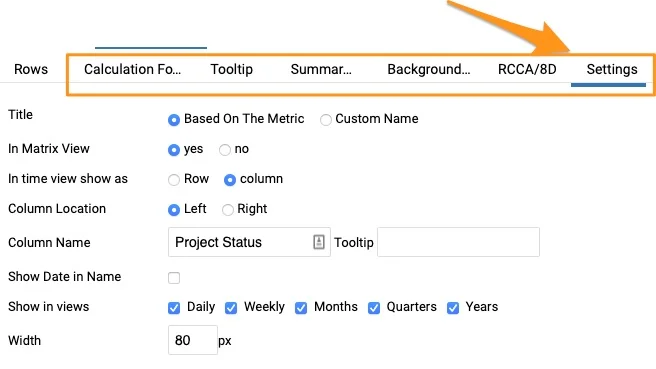
You can define other tabs if needed: Tooltip, Summary Row, Background Color, RCCA/8D and Settings.
Please contact us if you need any assistance setting up your dashboard.
Dostosuj ustawienia wskaźnika w dashboardzie i dodawaj lub wyświetlaj dodatkowe kolumny i wiersze. Najpierw opisujemy ustawienia ogólne, a potem dwa przykłady. Ta funkcja pozwala:
- Wyświetlać wartości wyliczane bez tworzenia nowego wskaźnika.
- Pokazywać informacje z nagłówka projektu w dashboardach projektów.
Ustawienia wskaźnika w dashboardzie
Otwórz ustawienia dashboardu
Przejdź do ustawień dashboardu za pomocą ołówka edycji.
Wybierz wskaźnik
Wybierz kartę Konfiguracja dashboardu i kliknij wskaźnik.
Wybierz rodzaj ustawień
Podmenu oferuje trzy rodzaje ustawień.
Domyślne dashboardu
Ustawienia Domyślne dashboardu określa się na karcie Ustawienia podstawowe. Obowiązują one dla wszystkich wskaźników w dashboardzie, chyba że wskaźnik ma własne ustawienia proste lub zaawansowane.
Proste
Ustawienia Proste pozwalają ustawić wybrane pola wskaźnika inaczej niż w ustawieniach podstawowych (np. inne progi alertów RCCA dla wybranych wskaźników, inne wartości narastające do wyświetlenia itd.).
Zaawansowane (beta)
Ustawienia Zaawansowane (beta) pozwalają dodawać dowolne wiersze i kolumny wskaźnika (np. status projektu, dodatkowe obliczenie itd.).
Jeśli ustawisz opcję Zaawansowane (beta), a potem zmienisz ją na Proste lub Domyślne dashboardu, wszystkie ustawienia zaawansowane zostaną usunięte.
Przykład 1: wartości wyliczane
-
Dodaj kolumnę. Załóżmy, że chcesz obliczyć stosunek wartości rzeczywistej do planu i pokazać go jako kolumnę. W ustawieniach dashboardu przejdź do wskaźnika, wybierz ustawienia Zaawansowane (beta) i dodaj kolumnę zielonym przyciskiem z plusem (Dodaj kolumnę).
-
Dodaj formułę. Powstała kolumna nr 2 (aktywna kolumna jest podkreślona). Przejdź na kartę Formuły obliczeniowe i kliknij Dodaj formułę.
-
Określ formułę. W pierwszym polu, Szablon formuły obliczeniowej, wybierz jedną z gotowych formuł albo wpisz własną w polu Formuła. Aby porównać wartości rzeczywiste z planem lub prognozą, w polu Oblicz wybierz opcję Rzeczywista. Formuła ustawia się automatycznie z domyślnym wskaźnikiem, ale w razie potrzeby możesz go zmienić.
-
Dodaj wiersz. Przejdź na kartę Wiersze i dodaj wiersz zielonym przyciskiem z plusem (Dodaj wiersz).
-
Wybierz formułę jako źródło. Wybierz formułę z menu Źródło.
-
Określ sposób wyświetlania. Przejdź na kartę Ustawienia i określ, czy chcesz widzieć wiersz, czy kolumnę, dodaj Własną nazwę, wybierz Pokaż w widokach, szerokość itd.
-
Zastosuj zmiany. Gdy wszystko jest gotowe, kliknij przycisk Zastosuj zmiany i zapisz ustawienia dashboardu.
-
Zobacz dashboard z kilkoma jednostkami. W dashboardzie z kilkoma jednostkami wartość wyliczana wygląda tak.
-
Zobacz pojedynczy zakład jako wiersz. Po kliknięciu konkretnego zakładu wartość ustawiona jako wiersz wygląda tak.
-
Zobacz pojedynczy zakład jako kolumnę. Jeśli w ustawieniach wybierzesz widok kolumny, wygląda to tak. Kolumnie musisz nadać inną własną nazwę.
Przykład 2: informacje z nagłówka projektu
Użyj danych listy działań jako źródła
Postępuj tak samo jak wyżej: dodaj kolumny i ustaw w każdej potrzebne wiersze. Potem jako Źródło wybierz Dane listy działań. W polu Widok wybierz, które informacje o projekcie chcesz widzieć (np. Status ogólny), a w ustawieniach dostosuj nazwę.
Pozostałe karty
W razie potrzeby ustaw też pozostałe karty: Podpowiedź, Wiersz podsumowania, Kolor tła, RCCA/8D i Ustawienia.
Jeśli potrzebujesz pomocy przy ustawianiu dashboardu, skontaktuj się z nami.
Potrzebujesz dalszej pomocy?
Napisz do nas. W dni robocze zwykle odpowiadamy w ciągu godziny.