高级(Beta):指标仪表板设置
本文由英文机器翻译。 当前显示英文原文。
Customize your metric’s settings in the dashboard and add or display more columns and rows as you need. The general settings are described first, followed by two examples. This functionality helps you to:
- View calculated values without creating a new metric.
- Display project header information in project dashboards.
Metric settings in the dashboard
Open the dashboard settings
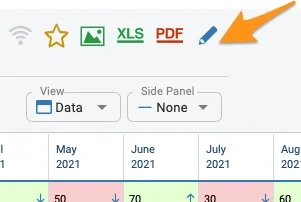
Go to your dashboard settings using the edit pencil.
Select the metric
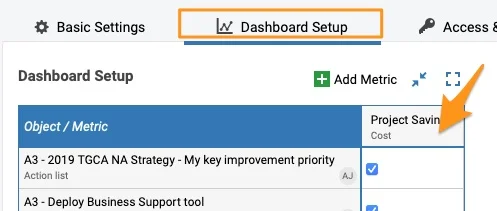
Select the Dashboard Setup tab and click the metric.
Choose a settings option
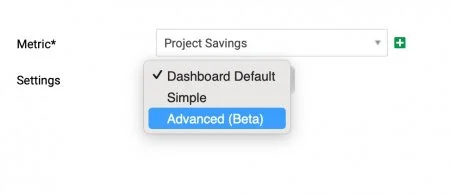
The submenu offers three settings options.
Dashboard Default
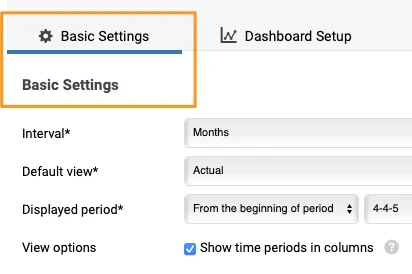
Dashboard Default is defined on the Basic Settings tab. It is the same setup for all metrics used in the dashboard, unless a metric is customized with the simple or advanced options.
Simple
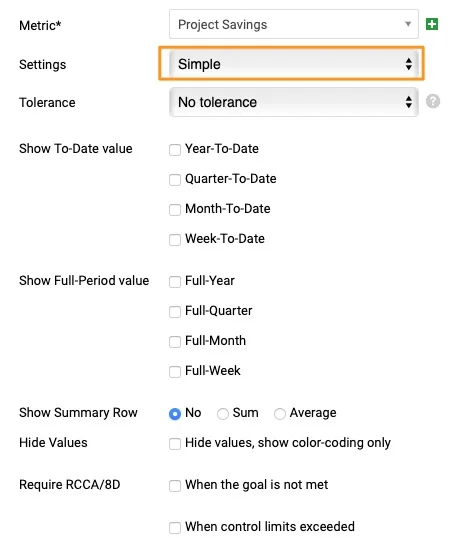
Simple settings let you set up specific fields of the metric differently than in the basic settings (e.g. different triggers for RCCA alerts for the metrics of your choice, other to-date values to show, etc.).
Advanced (Beta)
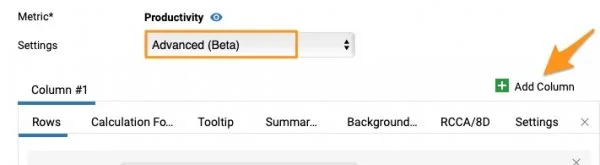
Advanced (Beta) lets you add metric rows and columns as you prefer (e.g. the status of your project, an extra calculation, etc.).
If you set up the Advanced (Beta) settings and then change them to Simple or Dashboard Default, all the advanced settings are removed.
Example 1: Calculated values
-
Add a column. Let’s say you want to calculate the Actual vs Plan value and display it as a column. Go to your metric in the dashboard settings, select the Advanced (Beta) settings and add a column by clicking the green plus button (Add Column).
-
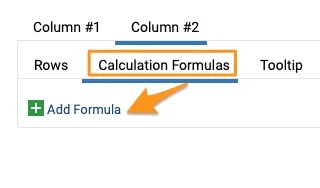
Add a formula. Your Column #2 is created (the active column is underlined). Go to the Calculation Formulas tab and click Add Formula.
-
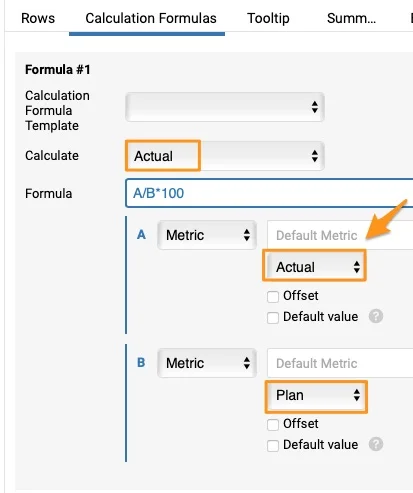
Define the formula. Select one of the preset formulas in the first field, Calculation Formula Template, or enter your own formula in the Formula field. To compare Actual values with Plan or Forecast, you must choose the Actual option in the Calculate field. The formula is set up automatically with a default metric, but you can change it if needed.
-
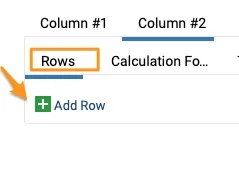
Add a row. Go to the Rows tab and add a row by clicking the green plus button (Add Row).
-
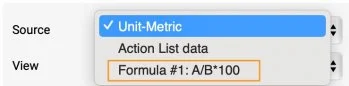
Select the formula as the source. Select your formula from the Source menu.
-
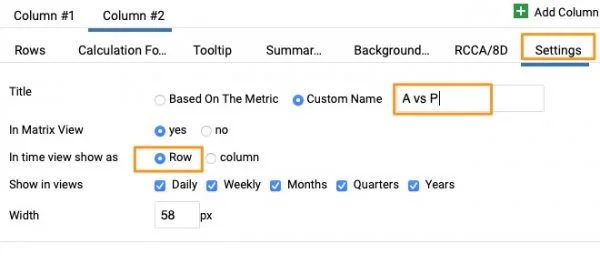
Define the display settings. Go to the Settings tab and define whether you want to see a row or a column, add a Custom name, choose Show in views, the width, etc.
-
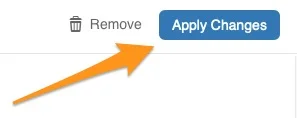
Apply the changes. When ready, click the Apply Changes button and save the dashboard settings.
-
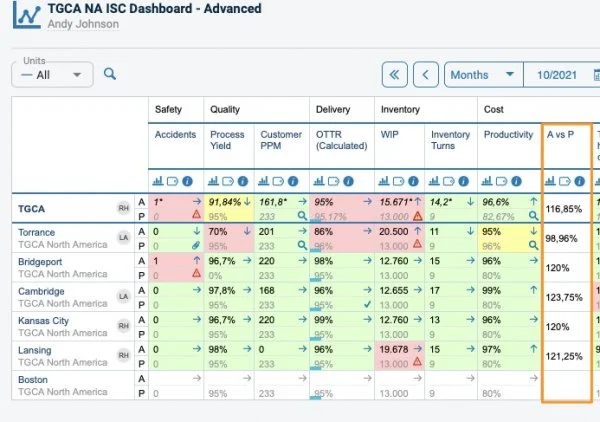
View the dashboard with several units. In a dashboard that includes several units, the calculated value is displayed like this.
-
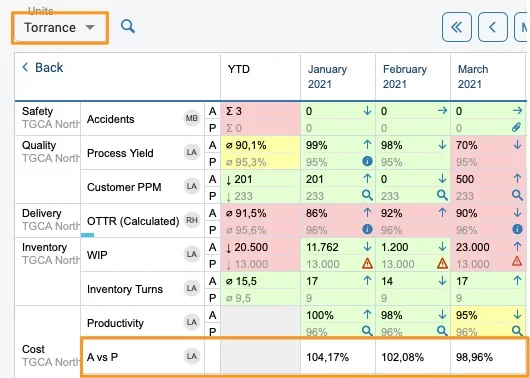
View a single site as a row. When you click a specific site, the value set up as a row is displayed like this.
-
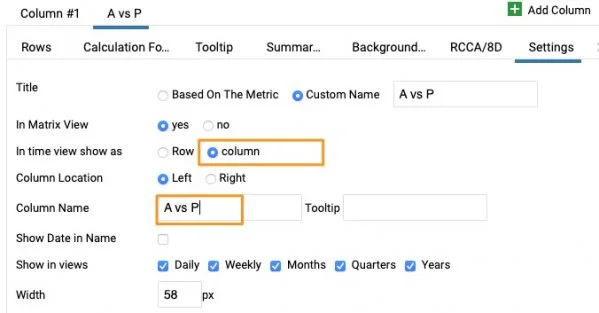
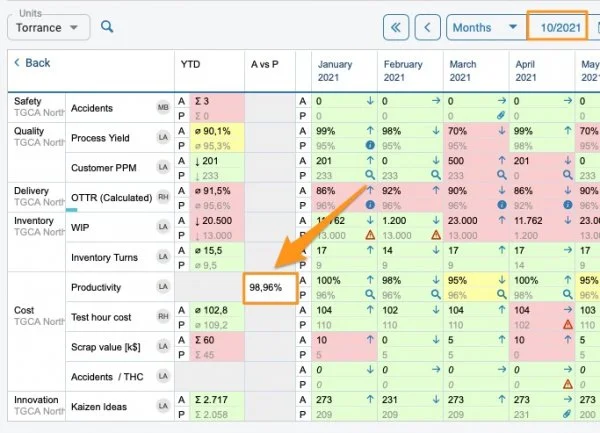
View a single site as a column. If you choose the column view in the settings, it is displayed like this. You have to give your column a different custom name.
Example 2: Display project header information
Use action list data as the source
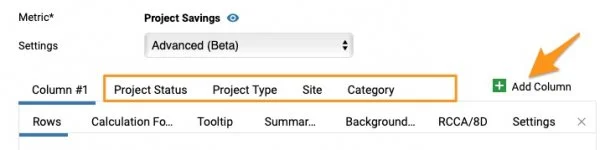
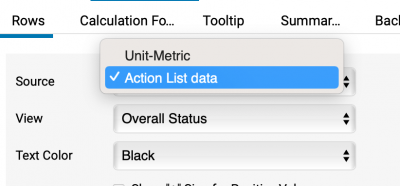
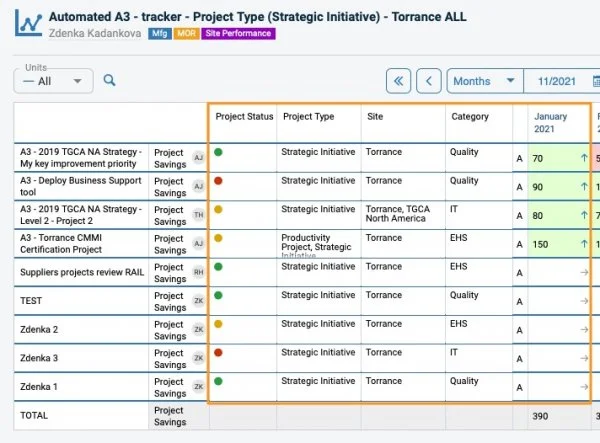
Follow the same process as above: add columns and set up each column with the rows you need. Then select Action List data as the Source. In the View field, choose what information from your project you want to see (e.g. Overall Status), and customize the name in the settings.
Other tabs
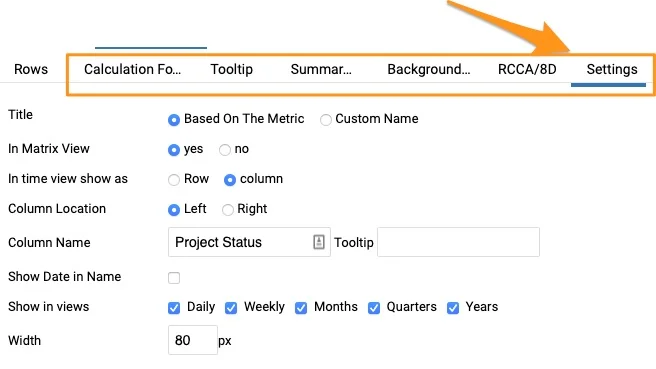
You can define other tabs if needed: Tooltip, Summary Row, Background Color, RCCA/8D and Settings.
Please contact us if you need any assistance setting up your dashboard.
在仪表板中自定义指标设置,根据需要添加或显示更多列和行。下文先介绍常规设置,再给出两个示例。此功能可以帮助您:
- 查看计算值,无需创建新指标。
- 显示项目标题栏信息,用于项目仪表板。
仪表板中的指标设置
打开仪表板设置
使用编辑铅笔图标进入仪表板设置。
选择指标
选择仪表板设置选项卡,点击指标。
选择设置选项
子菜单提供三个设置选项。
仪表板默认
仪表板默认在基本设置选项卡中定义。它对仪表板中使用的所有指标采用相同的设置,除非某个指标通过简单或高级选项进行了自定义。
简单
使用简单设置,可以将指标的特定字段设置得与基本设置不同(例如为所选指标设置不同的RCCA警报触发条件、显示其他累计值等)。
高级(Beta)
使用高级(Beta),可以根据需要添加指标的行和列(例如项目状态、额外计算等)。
如果设置了高级(Beta),之后又改为简单或仪表板默认,所有高级设置都会被删除。
示例1:计算值
-
添加列。 假设您想计算实际值与计划值的对比,并将其显示为一列。在仪表板设置中进入该指标,选择高级(Beta),然后点击绿色加号按钮(添加列)添加一列。
-
添加公式。 第2列已创建(当前列带有下划线)。进入计算公式选项卡,点击添加公式。
-
定义公式。 在第一个字段计算公式模板中选择一个预设公式,或在公式字段中输入自己的公式。要将实际值与计划值或预测值进行比较,必须在计算字段中选择实际值选项。系统会使用默认指标自动设置公式,如有需要,您可以更改。
-
添加行。 进入行选项卡,点击绿色加号按钮(添加行)添加一行。
-
选择公式作为来源。 从来源菜单中选择您的公式。
-
定义显示设置。 进入设置选项卡,定义显示为行还是列,添加自定义名称,选择在视图中显示、宽度等。
-
应用更改。 准备就绪后,点击应用更改按钮,并保存仪表板设置。
-
查看包含多个单元的仪表板。 在包含多个单元的仪表板中,计算值显示如下。
-
以行的形式查看单个站点。 点击某个站点后,设置为行的数值显示如下。
-
以列的形式查看单个站点。 如果在设置中选择列视图,显示效果如下。您必须为该列指定一个不同的自定义名称。
示例2:显示项目标题栏信息
使用行动清单数据作为来源
按照上述相同步骤操作:添加列,并为每一列设置所需的行。然后选择行动清单数据作为来源。在视图字段中,选择要显示的项目信息(例如总体状态),并在设置中自定义名称。
其他选项卡
如有需要,您还可以定义其他选项卡:提示信息、汇总行、背景色、RCCA/8D和设置。
如果在设置仪表板时需要任何帮助,请联系我们。
还需要帮助吗?
请给我们留言。工作日我们通常会在一小时内回复。