Rozšírené (Beta) – nastavenia KPI dashboardu
Strojový preklad z angličtiny. Zobrazený je anglický originál.
Customize your metric’s settings in the dashboard and add or display more columns and rows as you need. The general settings are described first, followed by two examples. This functionality helps you to:
- View calculated values without creating a new metric.
- Display project header information in project dashboards.
Metric settings in the dashboard
Open the dashboard settings
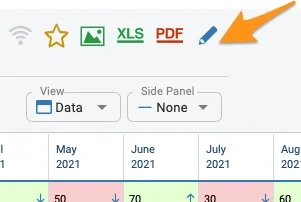
Go to your dashboard settings using the edit pencil.
Select the metric
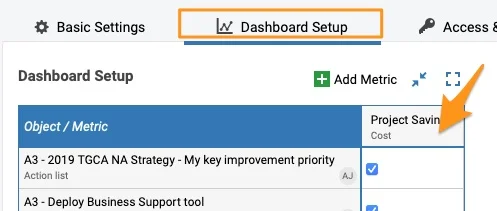
Select the Dashboard Setup tab and click the metric.
Choose a settings option
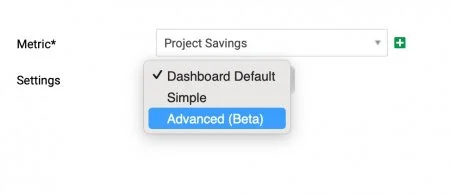
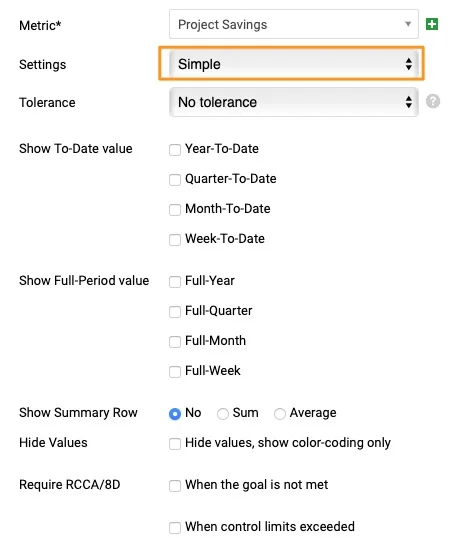
The submenu offers three settings options.
Dashboard Default
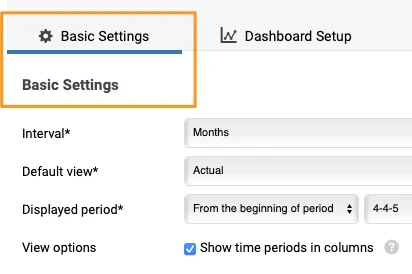
Dashboard Default is defined on the Basic Settings tab. It is the same setup for all metrics used in the dashboard, unless a metric is customized with the simple or advanced options.
Simple
Simple settings let you set up specific fields of the metric differently than in the basic settings (e.g. different triggers for RCCA alerts for the metrics of your choice, other to-date values to show, etc.).
Advanced (Beta)
Advanced (Beta) lets you add metric rows and columns as you prefer (e.g. the status of your project, an extra calculation, etc.).
If you set up the Advanced (Beta) settings and then change them to Simple or Dashboard Default, all the advanced settings are removed.
Example 1: Calculated values
-
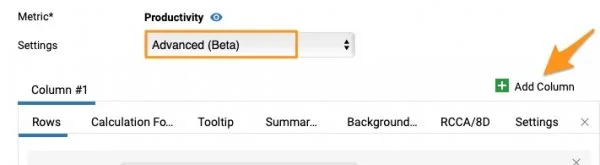
Add a column. Let’s say you want to calculate the Actual vs Plan value and display it as a column. Go to your metric in the dashboard settings, select the Advanced (Beta) settings and add a column by clicking the green plus button (Add Column).
-
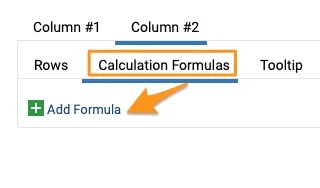
Add a formula. Your Column #2 is created (the active column is underlined). Go to the Calculation Formulas tab and click Add Formula.
-
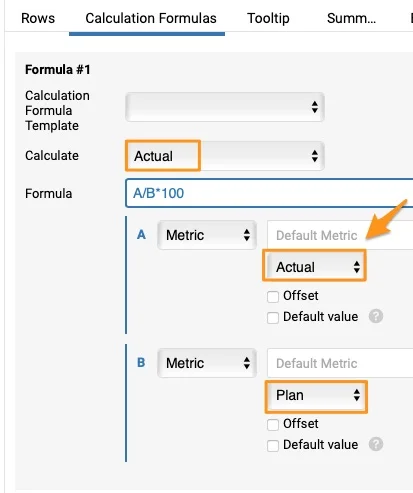
Define the formula. Select one of the preset formulas in the first field, Calculation Formula Template, or enter your own formula in the Formula field. To compare Actual values with Plan or Forecast, you must choose the Actual option in the Calculate field. The formula is set up automatically with a default metric, but you can change it if needed.
-
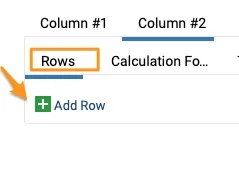
Add a row. Go to the Rows tab and add a row by clicking the green plus button (Add Row).
-
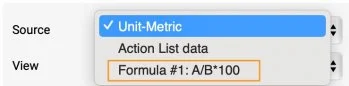
Select the formula as the source. Select your formula from the Source menu.
-
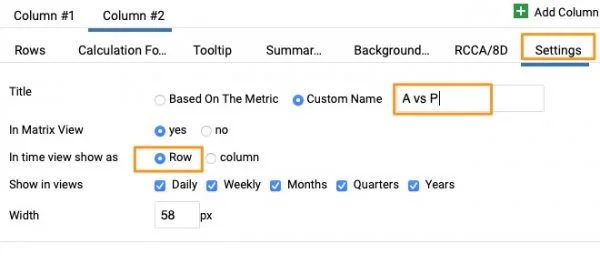
Define the display settings. Go to the Settings tab and define whether you want to see a row or a column, add a Custom name, choose Show in views, the width, etc.
-
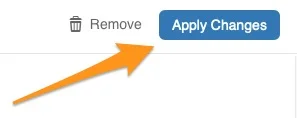
Apply the changes. When ready, click the Apply Changes button and save the dashboard settings.
-
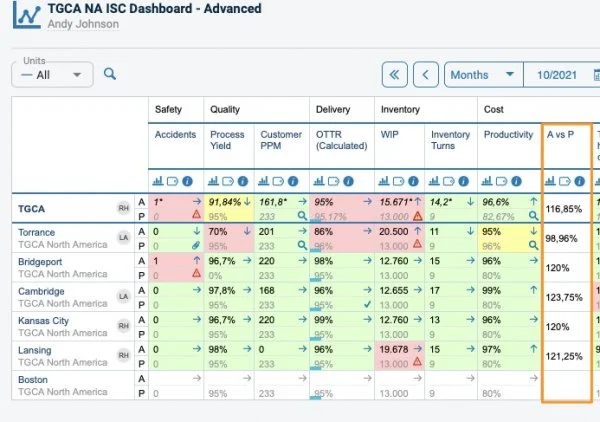
View the dashboard with several units. In a dashboard that includes several units, the calculated value is displayed like this.
-
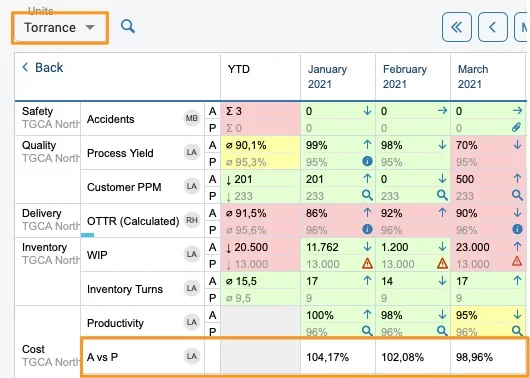
View a single site as a row. When you click a specific site, the value set up as a row is displayed like this.
-
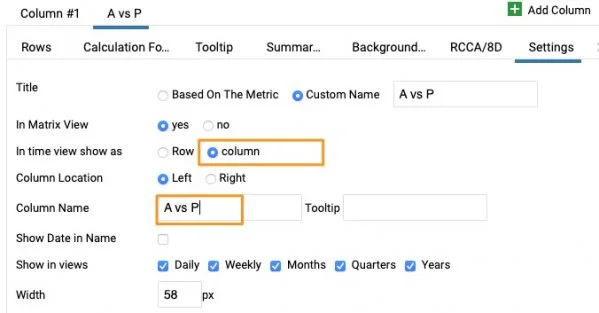
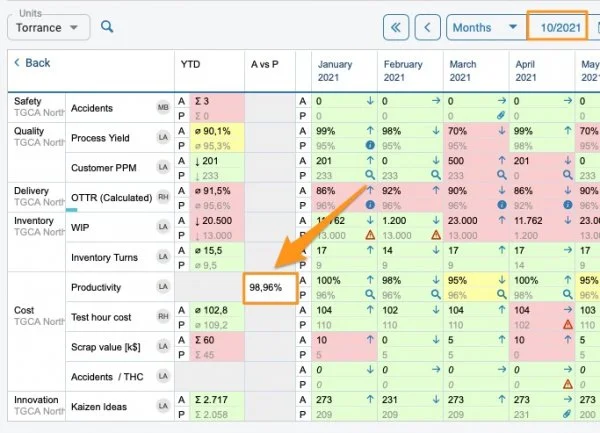
View a single site as a column. If you choose the column view in the settings, it is displayed like this. You have to give your column a different custom name.
Example 2: Display project header information
Use action list data as the source
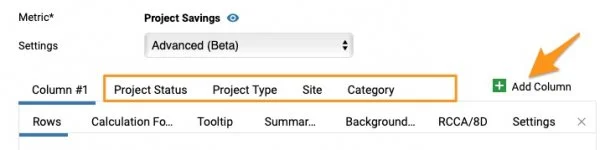
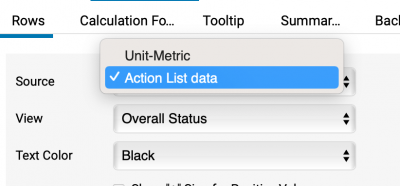
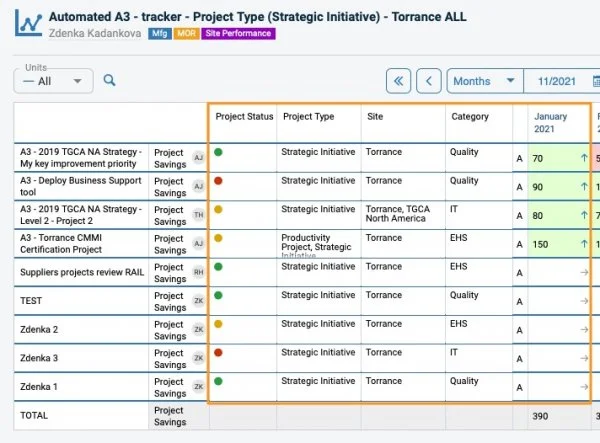
Follow the same process as above: add columns and set up each column with the rows you need. Then select Action List data as the Source. In the View field, choose what information from your project you want to see (e.g. Overall Status), and customize the name in the settings.
Other tabs
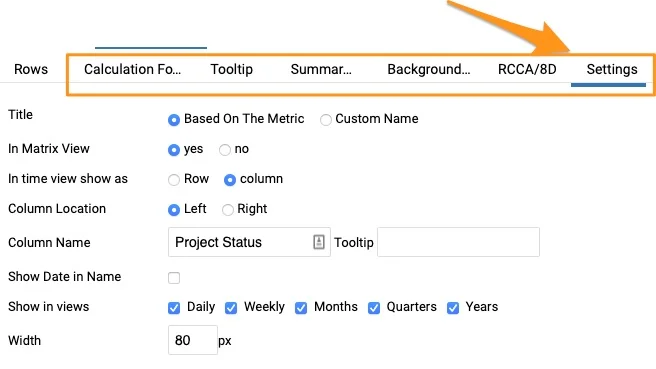
You can define other tabs if needed: Tooltip, Summary Row, Background Color, RCCA/8D and Settings.
Please contact us if you need any assistance setting up your dashboard.
Prispôsobte si nastavenia metriky v dashboarde a podľa potreby pridajte alebo zobrazte ďalšie stĺpce a riadky. Najprv popíšeme všeobecné nastavenia, potom dva príklady. Táto funkcia vám umožní:
- Zobraziť vypočítané hodnoty bez vytvárania novej metriky.
- Zobraziť údaje z hlavičky projektu v projektových dashboardoch.
Nastavenia metriky v dashboarde
Otvorte nastavenia dashboardu
Nastavenia dashboardu otvoríte ceruzkou.
Vyberte metriku
Vyberte kartu Nastavenie dashboardu a kliknite na metriku.
Zvoľte typ nastavení
Podmenu ponúka tri typy nastavení.
Predvolené dashboardu
Predvolené dashboardu sa určuje na karte Základné nastavenia. Platí rovnako pre všetky metriky v dashboarde, pokiaľ metrika nemá vlastné jednoduché alebo rozšírené nastavenia.
Jednoduché
Jednoduché nastavenia umožňujú nastaviť konkrétne polia metriky inak ako v základných nastaveniach (napr. iné spúšťače alertov RCCA pre vybrané metriky, iné zobrazené kumulatívne hodnoty atď.).
Rozšírené (Beta)
Rozšírené (Beta) umožňujú pridať riadky a stĺpce metriky podľa vašich potrieb (napr. stav projektu, dodatočný výpočet atď.).
Ak nastavíte Rozšírené (Beta) a potom ich zmeníte na Jednoduché alebo Predvolené dashboardu, všetky rozšírené nastavenia sa odstránia.
Príklad 1: Vypočítané hodnoty
-
Pridajte stĺpec. Povedzme, že chcete vypočítať hodnotu Skutočnosť vs. plán a zobraziť ju ako stĺpec. V nastaveniach dashboardu otvorte metriku, vyberte nastavenia Rozšírené (Beta) a pridajte stĺpec zeleným tlačidlom plus (Pridať stĺpec).
-
Pridajte vzorec. Vytvorí sa Stĺpec č. 2 (aktívny stĺpec je podčiarknutý). Prejdite na kartu Vzorce výpočtu a kliknite na Pridať vzorec.
-
Určte vzorec. V prvom poli Šablóna vzorca výpočtu vyberte niektorý z prednastavených vzorcov, alebo zadajte vlastný vzorec do poľa Vzorec. Ak chcete porovnať skutočné hodnoty s plánom alebo prognózou, musíte v poli Vypočítať zvoliť možnosť Skutočnosť. Vzorec sa automaticky nastaví s predvolenou metrikou, podľa potreby ju však môžete zmeniť.
-
Pridajte riadok. Prejdite na kartu Riadky a pridajte riadok zeleným tlačidlom plus (Pridať riadok).
-
Vyberte vzorec ako zdroj. V menu Zdroj vyberte svoj vzorec.
-
Určte nastavenia zobrazenia. Prejdite na kartu Nastavenia a určte, či chcete vidieť riadok alebo stĺpec, pridajte Vlastný názov, zvoľte Zobraziť v zobrazeniach, šírku atď.
-
Použite zmeny. Keď je všetko pripravené, kliknite na tlačidlo Použiť zmeny a uložte nastavenia dashboardu.
-
Pozrite si dashboard s viacerými jednotkami. V dashboarde s viacerými jednotkami sa vypočítaná hodnota zobrazí takto.
-
Pozrite si jeden závod ako riadok. Keď kliknete na konkrétny závod, hodnota nastavená ako riadok sa zobrazí takto.
-
Pozrite si jeden závod ako stĺpec. Ak v nastaveniach zvolíte zobrazenie ako stĺpec, zobrazí sa takto. Stĺpcu musíte dať iný vlastný názov.
Príklad 2: Zobrazenie údajov z hlavičky projektu
Použite dáta akčného zoznamu ako zdroj
Postupujte rovnako ako vyššie: pridajte stĺpce a každý stĺpec nastavte s potrebnými riadkami. Potom ako Zdroj vyberte Dáta akčného zoznamu. V poli Zobrazenie zvoľte, ktoré údaje z projektu chcete vidieť (napr. Celkový stav), a v nastaveniach upravte názov.
Ďalšie karty
Podľa potreby môžete nastaviť aj ďalšie karty: Popis, Súhrnný riadok, Farba pozadia, RCCA/8D a Nastavenia.
Ak potrebujete pomôcť s nastavením dashboardu, napíšte nám.
Potrebujete ďalšiu pomoc?
Napíšte nám. V pracovné dni zvyčajne odpovedáme do hodiny.