Jak wyświetlić wartości narastające od początku roku (YTD)
Tłumaczenie maszynowe z angielskiego. Wyświetlany jest oryginał po angielsku.
Metric dashboards give you the option to see all “to date” values.
Define the to-date formula
The formula for the YTD/QTD/MTD/WTD calculation is defined directly in the metric’s general settings, under Optional: Advanced Settings, as shown in the picture below.
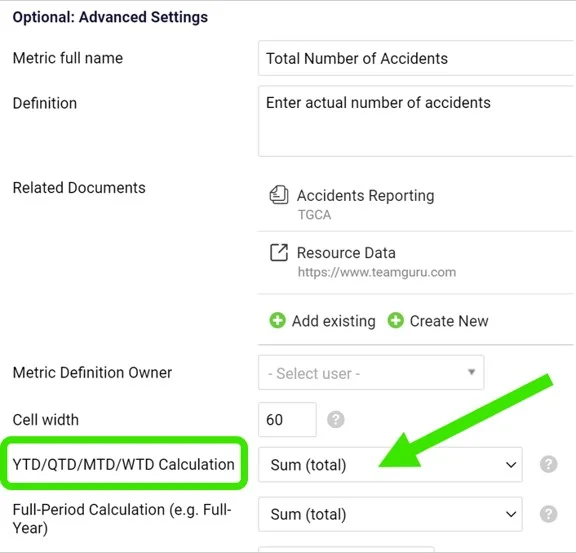
The calculation is usually defined when creating a new metric.
Show to-date values in the dashboard
To see the values in your metric dashboard, open the dashboard’s edit screen and follow these steps:
-
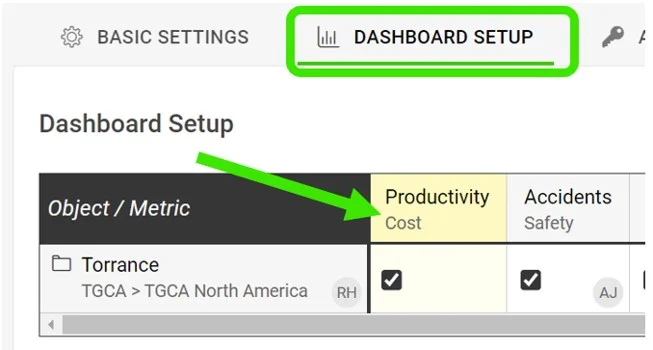
Open the dashboard settings. Go to the metric dashboard and click the Edit icon.

-
Select the metric. Click the particular metric you want to set up the to-date calculation for.
-
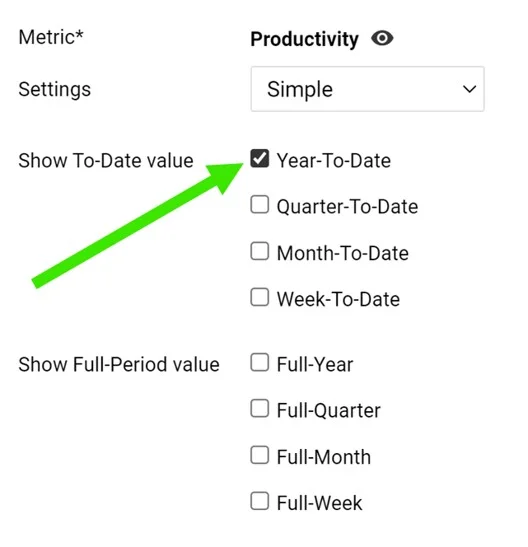
Tick the to-date values. Tick the boxes for YTD, QTD, MTD or WTD to display the values.
-
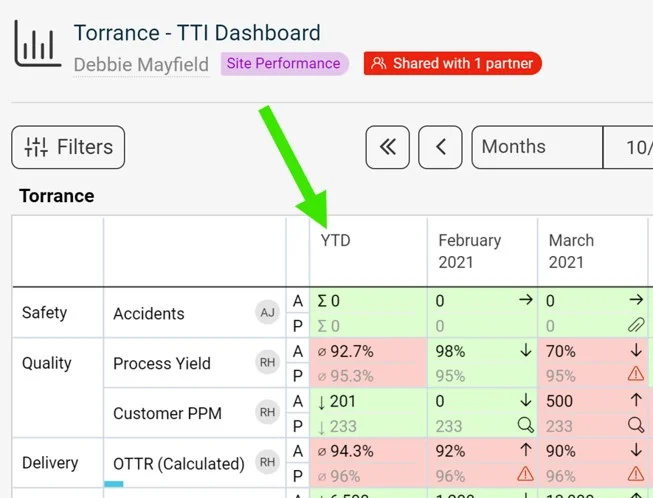
Save and view the dashboard. Click Save, then Save & View.
Dashboardy KPI pozwalają wyświetlić wszystkie wartości narastające („to date”).
Zdefiniuj formułę wartości narastających
Formułę obliczania YTD/QTD/MTD/WTD definiujesz bezpośrednio w ustawieniach ogólnych wskaźnika, w sekcji Opcjonalnie: Ustawienia zaawansowane, jak na obrazku poniżej.
Zwykle obliczenie ustawia się podczas tworzenia nowego wskaźnika.
Pokaż wartości narastające w dashboardzie
Aby zobaczyć te wartości w dashboardzie KPI, otwórz ekran edycji dashboardu i wykonaj te kroki:
-
Otwórz ustawienia dashboardu. Przejdź do dashboardu KPI i kliknij ikonę Edytuj.
-
Wybierz wskaźnik. Kliknij wskaźnik, dla którego chcesz ustawić wartości narastające.
-
Zaznacz wartości narastające. Zaznacz pola YTD, QTD, MTD lub WTD, aby wyświetlić te wartości.
-
Zapisz i otwórz dashboard. Kliknij Zapisz, a potem Zapisz i wyświetl.
Potrzebujesz dalszej pomocy?
Napisz do nas. W dni robocze zwykle odpowiadamy w ciągu godziny.