Jak utworzyć nowy wskaźnik – ustawienia podstawowe
Tłumaczenie maszynowe z angielskiego. Wyświetlany jest oryginał po angielsku.
Creating a metric in the system requires sufficient access. To keep metrics standardized across your company, agree internally on the name of each metric and its purpose. This ensures that everyone understands and uses the correct metrics.
We recommend contacting your system administrator when you need to create a new metric.
Create a new metric
-
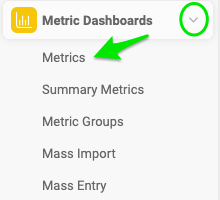
Open the metric list. Go to Metric Dashboards and select Metrics in the submenu.
-
Add a new metric. Click the Add icon to add a new metric.
-
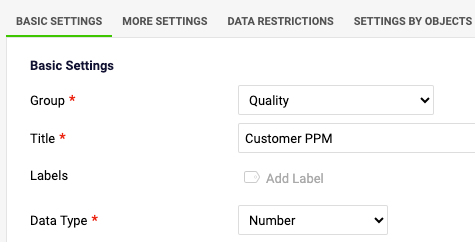
Fill in the basic settings. Fill in the metric definition in the Basic Settings section, as described below.
Basic settings of a metric
Select the group and title
Select the metric Group and fill in the Title of the metric. The title is visible in your dashboards.
Add labels
You can add metric Labels: use an existing label or create a new one. The metric label is displayed in all dashboards where the metric is used. You can also select for which part of the organization the label is used.
Select the data type
Select the Data Type: Number, Percentage, Date, Yes/No metric, or Text metric.
Set the units
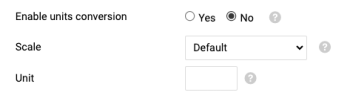
- Choose Yes if you want to enable units conversion.
- Choose a Scale (for thousands, millions, etc.) if needed.
- Fill in the measurement Unit (a symbol or abbreviation, e.g. $, €, USD).
Protect the metric
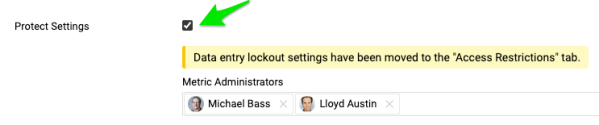
Protect Metric: if you tick this box, only the selected metric administrators can edit the metric’s settings.
Set the valid range of values
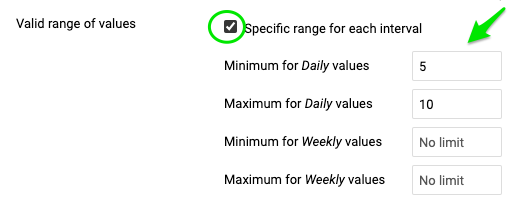
Valid range of values: define the minimum and maximum value for each time period, so that users cannot enter lower or higher values than defined.
Set the background color
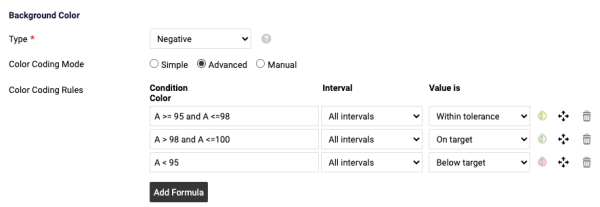
- Background Color: the metric type can be negative, positive or exact value.
- With the Simple color coding mode, you specify whether the values are compared to the Plan or to the Forecast values. If the priority is set to Forecast but you enter only Plan values, the values are automatically compared to the Plan values.
- With the Advanced color coding mode, you can customize the metric color coding according to the conditions you define.
Besides the metric’s basic settings, you can also set up additional rules on the other tabs.
Video guide: How to create a new metric
Related video guides: Enable Unit Conversion, Metric’s Definition & Related documents
Do utworzenia wskaźnika w systemie potrzebujesz odpowiednich uprawnień. Aby wskaźniki były jednolite w całej firmie, uzgodnijcie wewnętrznie nazwę i cel każdego wskaźnika. Dzięki temu wszyscy będą je rozumieć i używać właściwych.
Gdy potrzebujesz nowego wskaźnika, zalecamy skontaktować się z administratorem systemu.
Utwórz nowy wskaźnik
-
Otwórz listę wskaźników. Przejdź do Dashboardów KPI i w podmenu wybierz Wskaźniki.
-
Dodaj nowy wskaźnik. Kliknij ikonę Dodaj, aby dodać nowy wskaźnik.
-
Uzupełnij ustawienia podstawowe. Uzupełnij definicję wskaźnika w sekcji Ustawienia podstawowe, jak opisano poniżej.
Ustawienia podstawowe wskaźnika
Wybierz grupę i tytuł
Wybierz Grupę wskaźnika i wpisz jego Tytuł. Tytuł jest widoczny w dashboardach.
Dodaj etykiety
Możesz dodać Etykiety wskaźnika: użyj istniejącej etykiety lub utwórz nową. Etykieta wskaźnika jest widoczna we wszystkich dashboardach, w których używasz wskaźnika. Możesz też wybrać, w której części organizacji etykieta ma być używana.
Wybierz typ danych
Wybierz Typ danych: liczba, procent, data, wskaźnik tak/nie lub wskaźnik tekstowy.
Ustaw jednostki
- Wybierz Tak, jeśli chcesz włączyć przeliczanie jednostek.
- W razie potrzeby wybierz Skalę (tysiące, miliony itd.).
- Wpisz Jednostkę miary (symbol lub skrót, np. $, €, USD).
Chroń wskaźnik
Chroń wskaźnik: gdy zaznaczysz to pole, ustawienia wskaźnika będą mogli edytować tylko wybrani administratorzy wskaźnika.
Ustaw dopuszczalny zakres wartości
Dopuszczalny zakres wartości: określ minimalną i maksymalną wartość dla każdego okresu, aby użytkownicy nie mogli wpisać wartości niższych ani wyższych.
Ustaw kolor tła
- Kolor tła: typ wskaźnika może być negatywny, pozytywny lub dokładna wartość.
- W trybie kolorowania Prosty wskazujesz, czy wartości są porównywane z planem, czy z prognozą. Jeśli priorytetem jest prognoza, a wpiszesz tylko wartości planowane, wartości zostaną automatycznie porównane z planem.
- W trybie kolorowania Zaawansowany dostosujesz kolorowanie wskaźnika do zdefiniowanych przez siebie warunków.
Oprócz ustawień podstawowych wskaźnika możesz ustawić dodatkowe reguły na pozostałych kartach.
Wideo: jak utworzyć nowy wskaźnik
Powiązane wideo: Włącz przeliczanie jednostek, Definicja wskaźnika i powiązane dokumenty
Potrzebujesz dalszej pomocy?
Napisz do nas. W dni robocze zwykle odpowiadamy w ciągu godziny.