Estatísticas do dashboard de KPI
Tradução automática do inglês. Exibindo o original em inglês.
View your metric dashboard statistics in a chart and customize it based on your preference.
You can also learn about the trend chart and metric dashboard charts view functionality.
Watch the video guide, or follow the text instructions below.
View the statistics
-
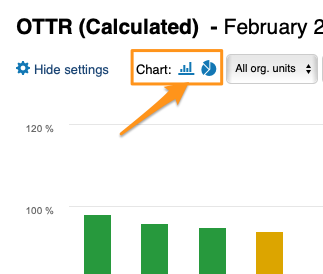
Open the statistics. Click the column chart icon to view your dashboard statistics. The screenshots show the icon in different dashboard views.
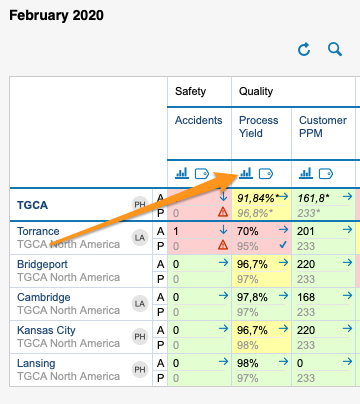
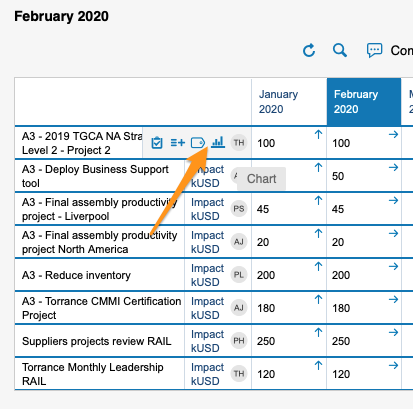
You can view statistics only if there is more than one org. unit, project or partner in your dashboard.
-
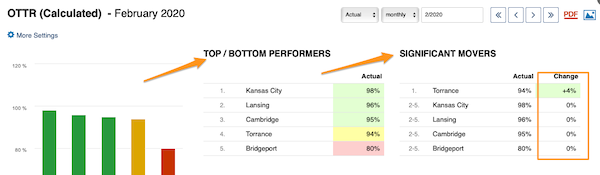
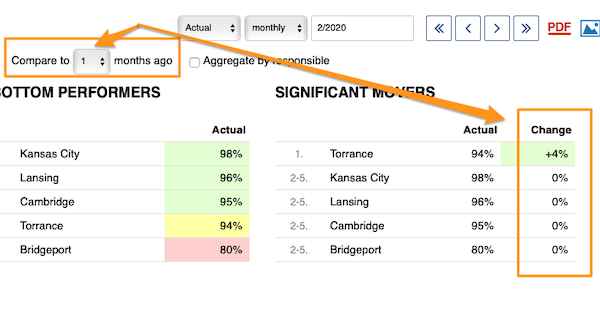
Read the basic view. The basic view shows your base (input) units, the Top/Bottom performers (sorted from the best results down) and the Significant Movers, with an extra column comparing the performance with the last period.
-
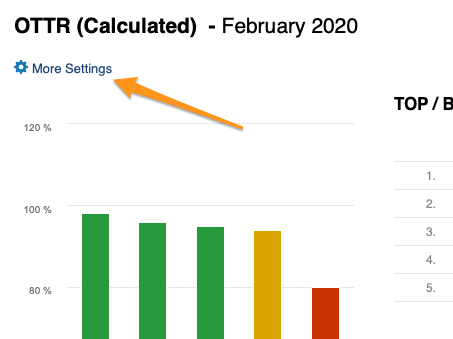
Open More Settings. Click the More Settings button in the upper left corner to customize your view.
Customize the statistics
Choose a bar or pie chart
Choose either the bar or the pie chart view.
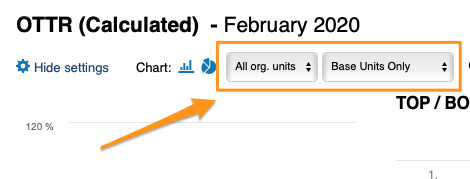
Select the units
Select the units you want to view in your chart.
Compare to previous periods
With Compare to, you choose from the submenu how many periods (1–12) to go back to compare the performance with the current period under Significant Movers.
The period is based on your selection.
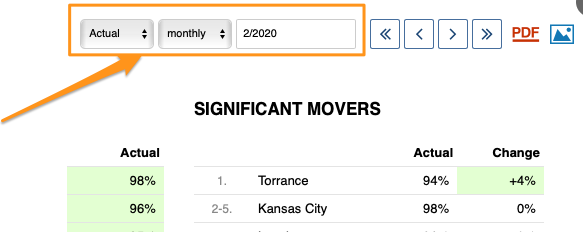
Show the change in values or percent
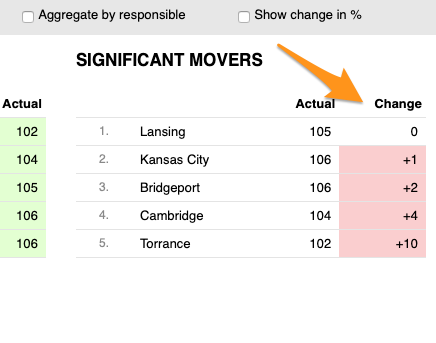
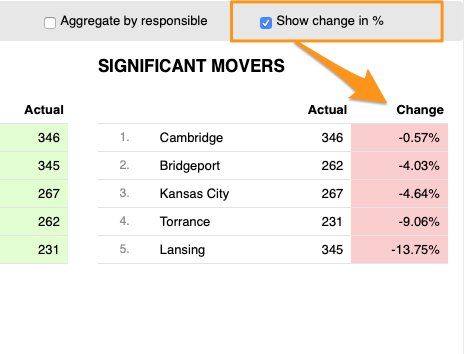
You can display the change in performance compared with another time period either in absolute values or in percent.
Skip weekends
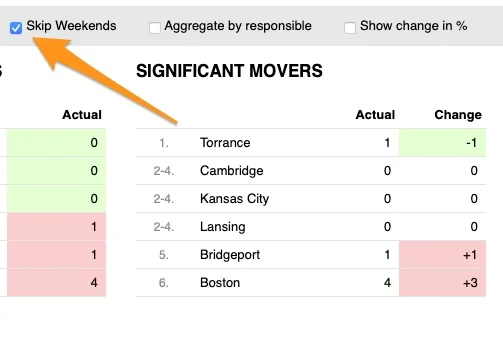
You can also Skip Weekends in the comparison data of your significant movers.
Aggregate by responsible
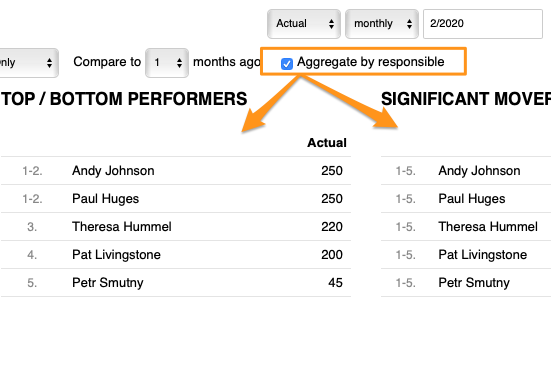
With Aggregate by responsible, you can summarize the data for all org. units or projects in the dashboard per responsible person.
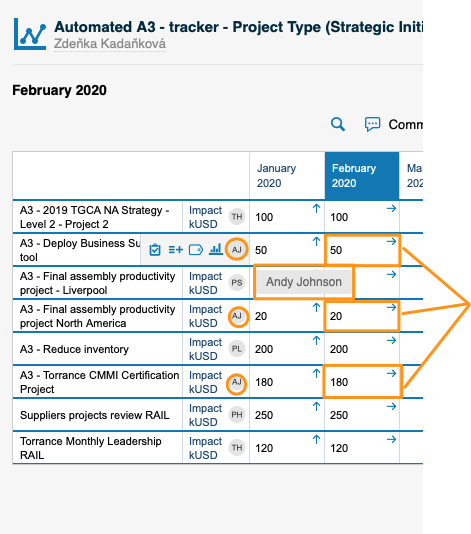
Set up the responsible in the metric dashboard
Use the project leader in automatic dashboards
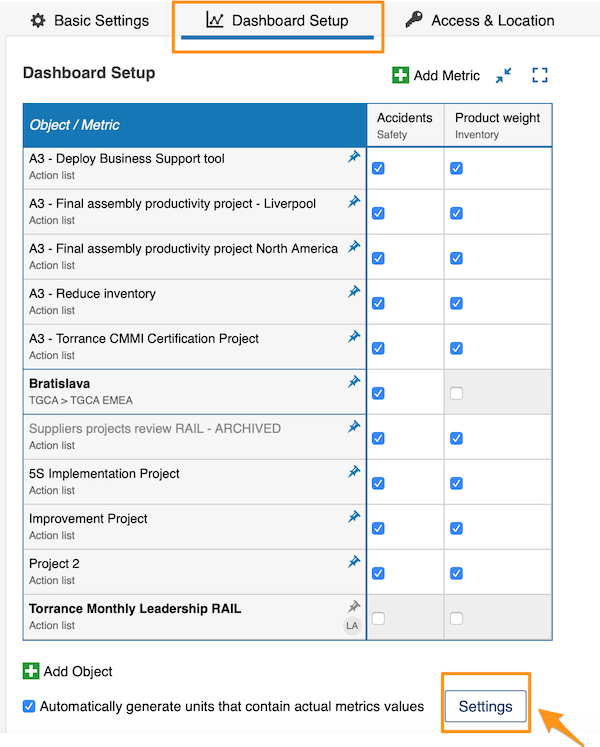
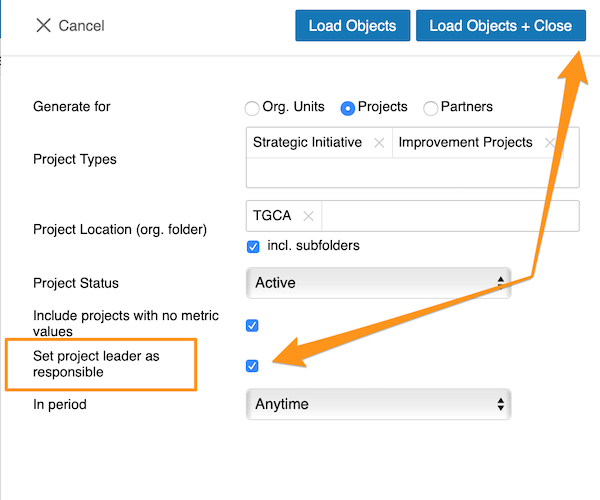
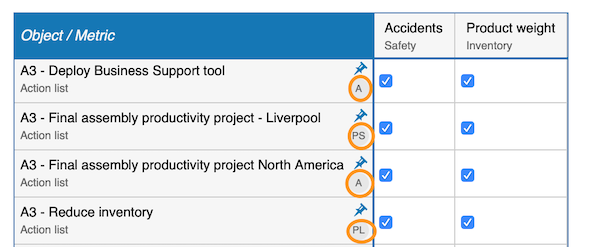
When you use an automatic metric dashboard, click the Settings button at the bottom and tick the Set project leader as responsible box. The responsible is then added to your dashboard automatically.
Choose the responsible per cell
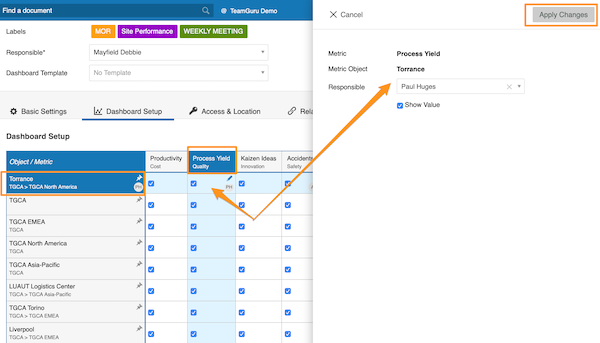
If you do not use an automatic metric dashboard, or you want to choose your responsible manually, go to your dashboard settings and open the Dashboard Setup tab.
There, you can select the responsible for an org. unit and metric combination: click the cell, add your responsible and apply the changes.
Choose the responsible per org. unit
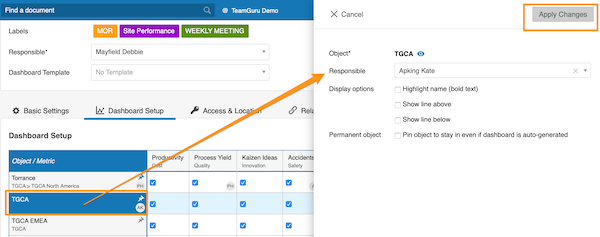
Alternatively, select the responsible for the whole org. unit: click the org. unit, choose the responsible and apply the changes.
See the responsible in the dashboard
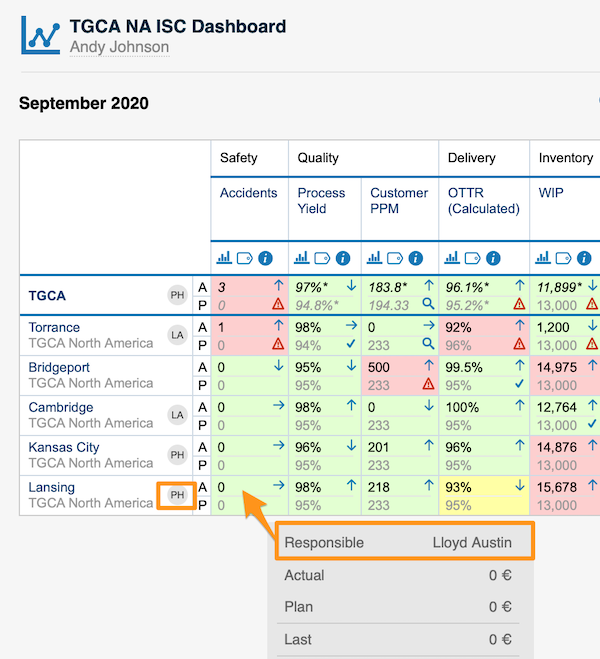
For an org. unit or project, the responsible’s initials are displayed right next to it; when you hover over the initials, you see the full name.
For an org. unit and metric combination, the responsible is shown in a pop-up window along with other data when you hover over the cell.
You can assign only one responsible per project.
Veja as estatísticas do dashboard de KPI em um gráfico e personalize-o como preferir.
Conheça também a função de gráfico de tendência e visualização de gráficos do dashboard de KPI.
Assista ao guia em vídeo ou siga as instruções em texto abaixo.
Veja as estatísticas
-
Abra as estatísticas. Clique no ícone de gráfico de colunas para ver as estatísticas do dashboard. As capturas de tela mostram o ícone em diferentes visualizações do dashboard.
As estatísticas só ficam disponíveis se houver mais de uma unidade org., projeto ou parceiro no dashboard.
-
Leia a visualização básica. A visualização básica mostra as unidades de base (de entrada), os Melhores/Piores desempenhos (ordenados do melhor resultado para baixo) e as Maiores variações, com uma coluna extra que compara o desempenho com o último período.
-
Abra Mais configurações. Clique no botão Mais configurações no canto superior esquerdo para personalizar a visualização.
Personalize as estatísticas
Escolha gráfico de barras ou de pizza
Escolha a visualização em gráfico de barras ou de pizza.
Selecione as unidades
Selecione as unidades que deseja ver no gráfico.
Compare com períodos anteriores
Em Comparar com, escolha no submenu quantos períodos (1–12) voltar para comparar o desempenho com o período atual em Maiores variações.
O período depende da sua seleção.
Mostre a variação em valores ou em percentual
Você pode exibir a variação de desempenho em relação a outro período em valores absolutos ou em percentual.
Ignore os fins de semana
Você também pode usar Ignorar fins de semana nos dados de comparação das maiores variações.
Agrupe por responsável
Com Agrupar por responsável, você resume os dados de todas as unidades org. ou projetos do dashboard por responsável.
Defina o responsável no dashboard de KPI
Use o líder do projeto em dashboards automáticos
Em um dashboard de KPI automático, clique no botão Configurações na parte inferior e marque a caixa Definir líder do projeto como responsável. O responsável é adicionado automaticamente ao dashboard.
Escolha o responsável por célula
Se você não usa um dashboard de KPI automático ou quer escolher o responsável manualmente, abra as configurações do dashboard e a aba Configuração do dashboard.
Ali, você pode selecionar o responsável por uma combinação de unidade org. e métrica: clique na célula, adicione o responsável e aplique as alterações.
Escolha o responsável por unidade org.
Outra opção é selecionar o responsável pela unidade org. inteira: clique na unidade org., escolha o responsável e aplique as alterações.
Veja o responsável no dashboard
Para uma unidade org. ou um projeto, as iniciais do responsável aparecem logo ao lado; ao passar o mouse sobre elas, você vê o nome completo.
Para uma combinação de unidade org. e métrica, o responsável aparece em uma janela pop-up, junto com outros dados, quando você passa o mouse sobre a célula.
Cada projeto pode ter só um responsável.
Precisa de mais ajuda?
Escreva para nós. Em dias úteis, costumamos responder em até uma hora.