Štatistiky KPI dashboardu
Strojový preklad z angličtiny. Zobrazený je anglický originál.
View your metric dashboard statistics in a chart and customize it based on your preference.
You can also learn about the trend chart and metric dashboard charts view functionality.
Watch the video guide, or follow the text instructions below.
View the statistics
-
Open the statistics. Click the column chart icon to view your dashboard statistics. The screenshots show the icon in different dashboard views.
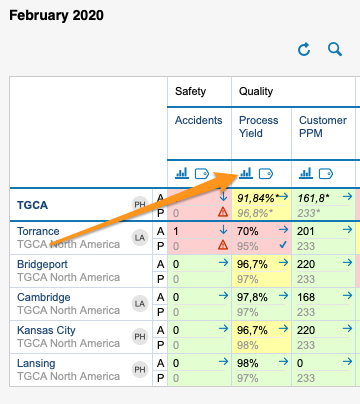
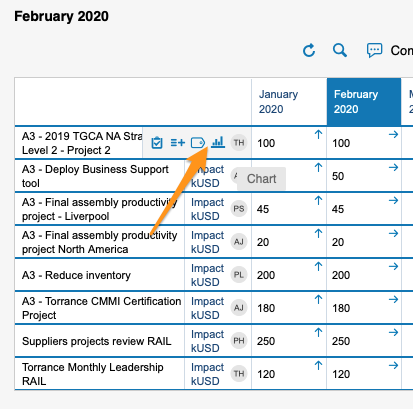
You can view statistics only if there is more than one org. unit, project or partner in your dashboard.
-
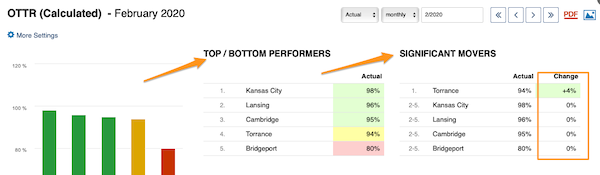
Read the basic view. The basic view shows your base (input) units, the Top/Bottom performers (sorted from the best results down) and the Significant Movers, with an extra column comparing the performance with the last period.
-
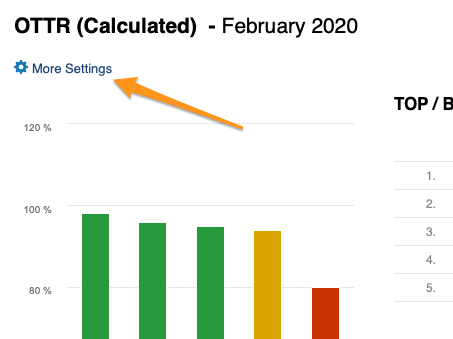
Open More Settings. Click the More Settings button in the upper left corner to customize your view.
Customize the statistics
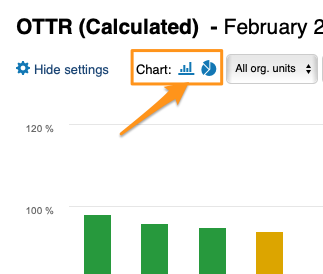
Choose a bar or pie chart
Choose either the bar or the pie chart view.
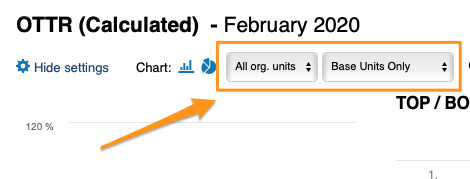
Select the units
Select the units you want to view in your chart.
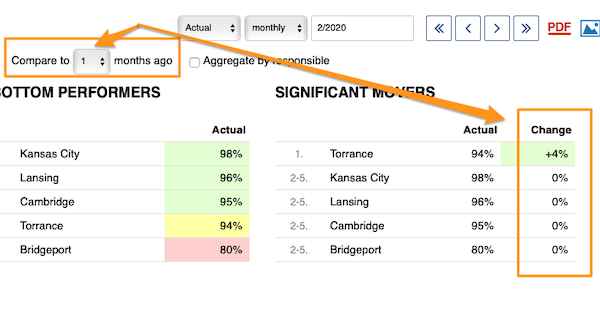
Compare to previous periods
With Compare to, you choose from the submenu how many periods (1–12) to go back to compare the performance with the current period under Significant Movers.
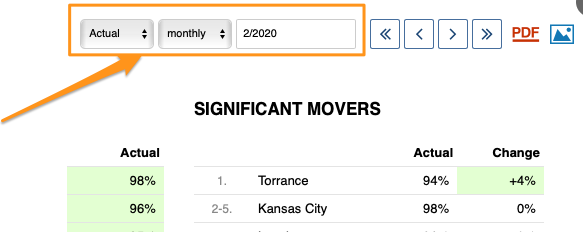
The period is based on your selection.
Show the change in values or percent
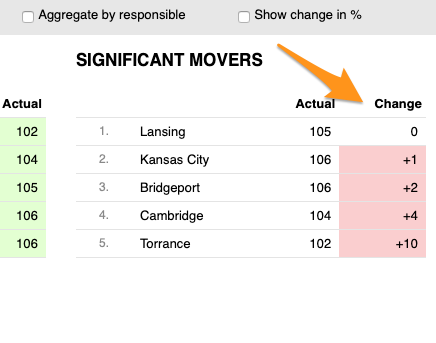
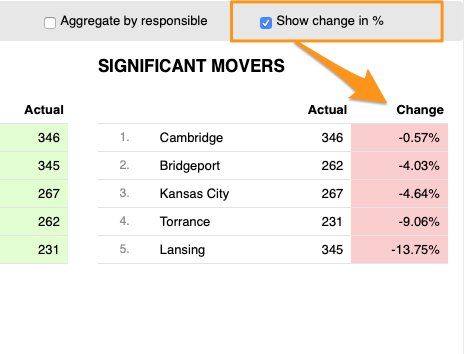
You can display the change in performance compared with another time period either in absolute values or in percent.
Skip weekends
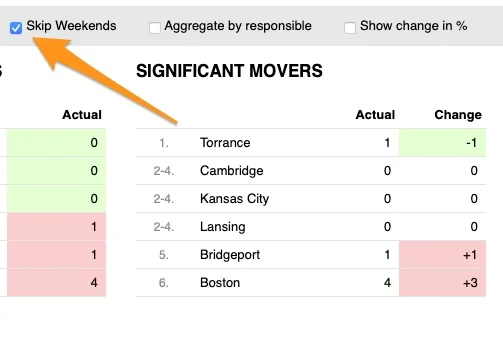
You can also Skip Weekends in the comparison data of your significant movers.
Aggregate by responsible
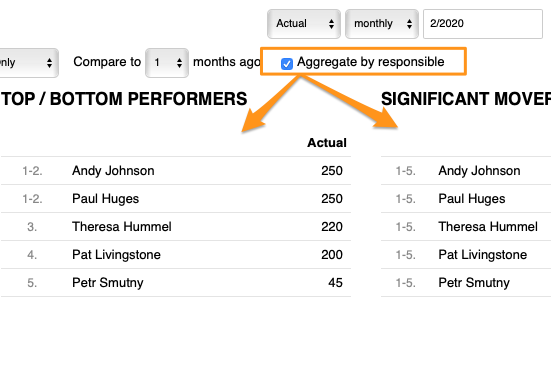
With Aggregate by responsible, you can summarize the data for all org. units or projects in the dashboard per responsible person.
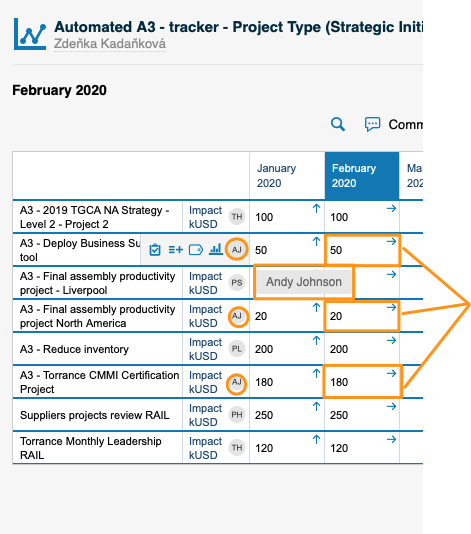
Set up the responsible in the metric dashboard
Use the project leader in automatic dashboards
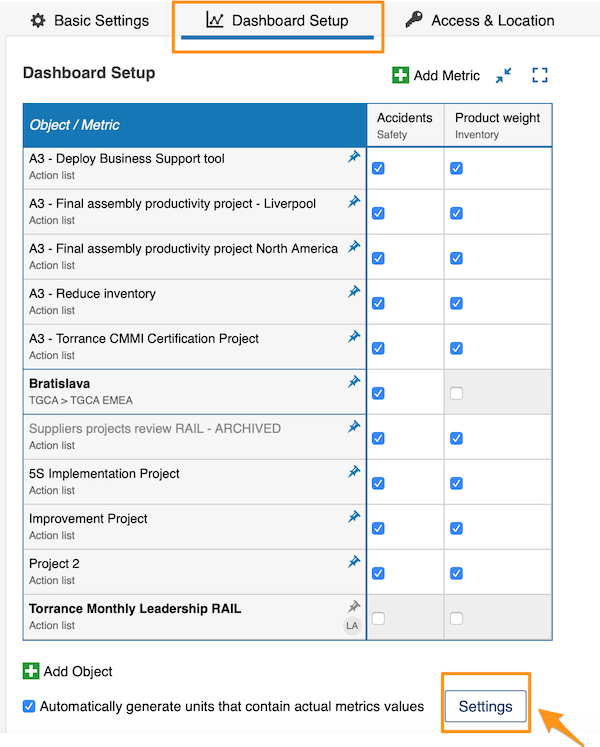
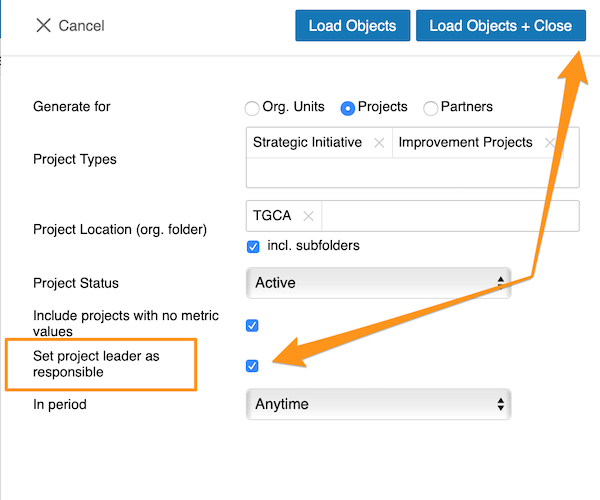
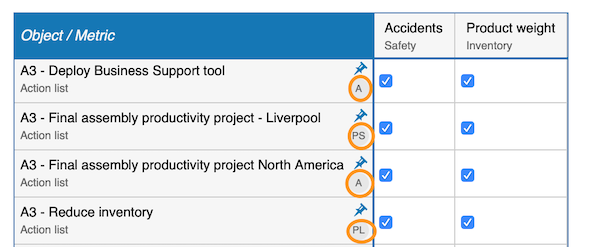
When you use an automatic metric dashboard, click the Settings button at the bottom and tick the Set project leader as responsible box. The responsible is then added to your dashboard automatically.
Choose the responsible per cell
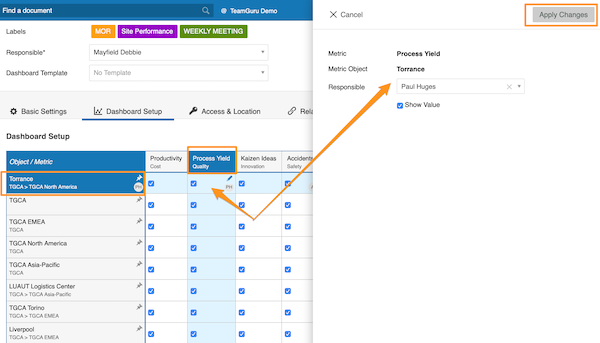
If you do not use an automatic metric dashboard, or you want to choose your responsible manually, go to your dashboard settings and open the Dashboard Setup tab.
There, you can select the responsible for an org. unit and metric combination: click the cell, add your responsible and apply the changes.
Choose the responsible per org. unit
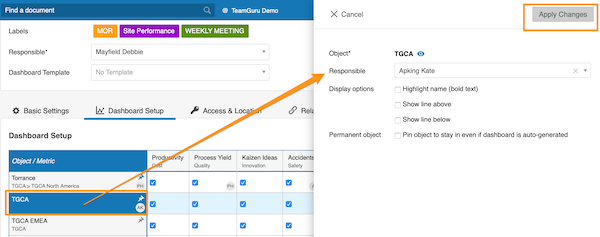
Alternatively, select the responsible for the whole org. unit: click the org. unit, choose the responsible and apply the changes.
See the responsible in the dashboard
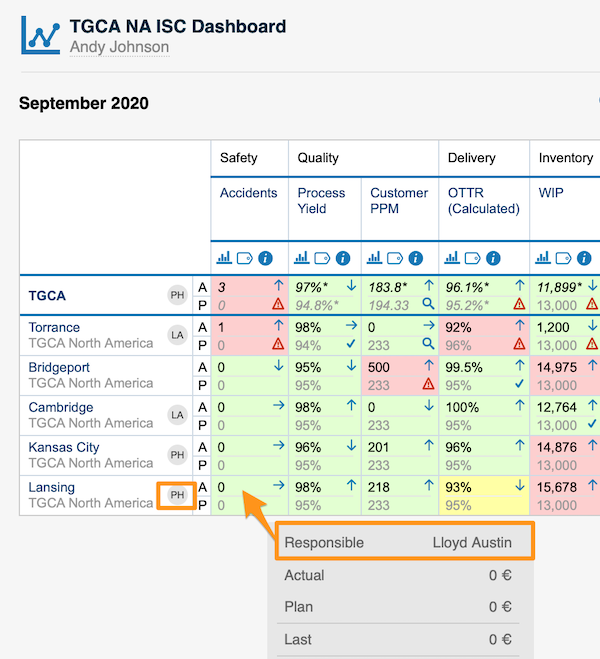
For an org. unit or project, the responsible’s initials are displayed right next to it; when you hover over the initials, you see the full name.
For an org. unit and metric combination, the responsible is shown in a pop-up window along with other data when you hover over the cell.
You can assign only one responsible per project.
Pozrite si štatistiky KPI dashboardu v grafe a prispôsobte si ho podľa svojich potrieb.
Môžete sa zoznámiť aj s funkciou trendový graf a zobrazenie grafov KPI dashboardu.
Pozrite si video návod alebo postupujte podľa textu nižšie.
Zobrazenie štatistík
-
Otvorte štatistiky. Štatistiky dashboardu zobrazíte kliknutím na ikonu stĺpcového grafu. Snímky obrazovky ukazujú ikonu v rôznych zobrazeniach dashboardu.
Štatistiky sa dajú zobraziť iba vtedy, ak je v dashboarde viac ako jedna org. jednotka, projekt alebo partner.
-
Prečítajte si základné zobrazenie. Základné zobrazenie ukazuje vaše základné (vstupné) jednotky, Najlepší/najhorší (zoradené od najlepších výsledkov) a Výrazné zmeny s ďalším stĺpcom, ktorý porovnáva výkonnosť s minulým obdobím.
-
Otvorte Ďalšie nastavenia. Zobrazenie si prispôsobíte kliknutím na tlačidlo Ďalšie nastavenia v ľavom hornom rohu.
Prispôsobenie štatistík
Zvoľte stĺpcový alebo koláčový graf
Zvoľte zobrazenie stĺpcového alebo koláčového grafu.
Vyberte jednotky
Vyberte jednotky, ktoré chcete v grafe zobraziť.
Porovnanie s predchádzajúcimi obdobiami
V položke Porovnať s vyberiete v podmenu, o koľko období (1–12) sa vrátiť a porovnať výkonnosť s aktuálnym obdobím v časti Výrazné zmeny.
Obdobie zodpovedá vášmu výberu.
Zobrazenie zmeny v hodnotách alebo percentách
Zmenu výkonnosti oproti inému obdobiu môžete zobraziť v absolútnych hodnotách alebo v percentách.
Vynechanie víkendov
V porovnávacích údajoch výrazných zmien môžete tiež zvoliť Vynechať víkendy.
Zoskupenie podľa zodpovedného
Pomocou Zoskupiť podľa zodpovedného zhrniete údaje všetkých org. jednotiek alebo projektov v dashboarde podľa zodpovednej osoby.
Nastavenie zodpovednej osoby v KPI dashboarde
Vedúci projektu v automatických dashboardoch
Ak používate automatický KPI dashboard, kliknite dole na tlačidlo Nastavenia a začiarknite pole Nastaviť vedúceho projektu ako zodpovedného. Zodpovedná osoba sa potom do dashboardu pridá automaticky.
Zodpovedná osoba pre bunku
Ak nepoužívate automatický KPI dashboard alebo chcete zodpovednú osobu zvoliť ručne, prejdite do nastavení dashboardu a otvorte kartu Nastavenie dashboardu.
Tam môžete vybrať zodpovednú osobu pre kombináciu org. jednotky a metriky: kliknite na bunku, pridajte zodpovednú osobu a zmeny použite.
Zodpovedná osoba pre org. jednotku
Prípadne vyberte zodpovednú osobu pre celú org. jednotku: kliknite na org. jednotku, zvoľte zodpovednú osobu a zmeny použite.
Zodpovedná osoba v dashboarde
Pri org. jednotke alebo projekte sa iniciály zodpovednej osoby zobrazujú hneď vedľa neho; keď na iniciály prejdete myšou, uvidíte celé meno.
Pri kombinácii org. jednotky a metriky sa zodpovedná osoba zobrazí spolu s ďalšími údajmi vo vyskakovacom okne, keď prejdete myšou nad bunku.
Pre každý projekt môžete priradiť iba jednu zodpovednú osobu.
Potrebujete ďalšiu pomoc?
Napíšte nám. V pracovné dni zvyčajne odpovedáme do hodiny.