Estadísticas del dashboard de KPI
Traducción automática del inglés. Se muestra el original en inglés.
View your metric dashboard statistics in a chart and customize it based on your preference.
You can also learn about the trend chart and metric dashboard charts view functionality.
Watch the video guide, or follow the text instructions below.
View the statistics
-
Open the statistics. Click the column chart icon to view your dashboard statistics. The screenshots show the icon in different dashboard views.
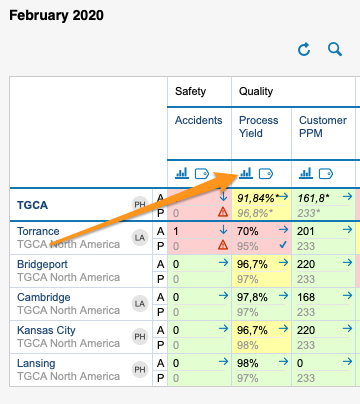
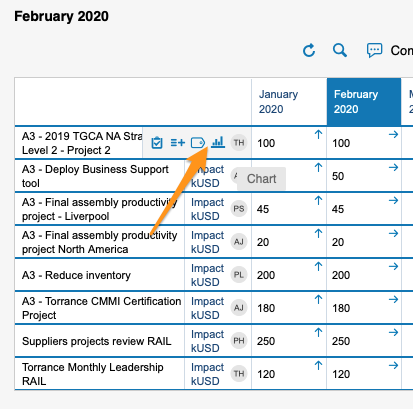
You can view statistics only if there is more than one org. unit, project or partner in your dashboard.
-
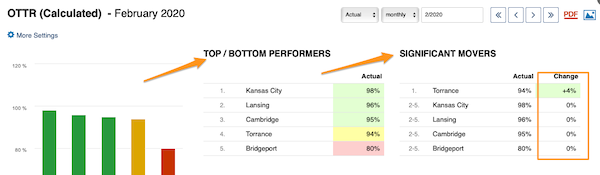
Read the basic view. The basic view shows your base (input) units, the Top/Bottom performers (sorted from the best results down) and the Significant Movers, with an extra column comparing the performance with the last period.
-
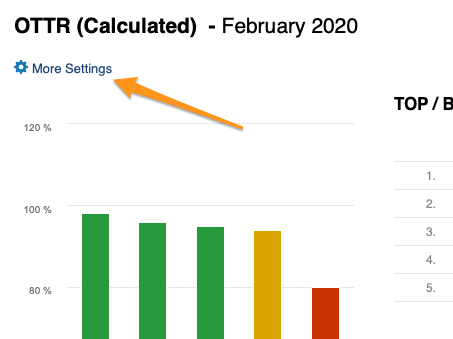
Open More Settings. Click the More Settings button in the upper left corner to customize your view.
Customize the statistics
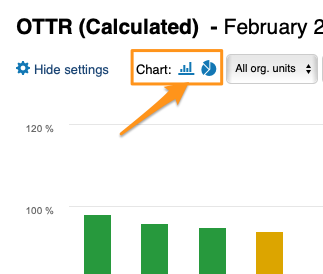
Choose a bar or pie chart
Choose either the bar or the pie chart view.
Select the units
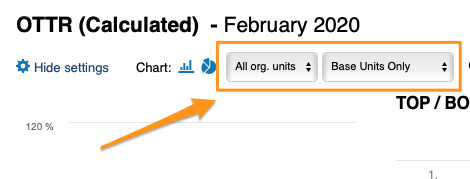
Select the units you want to view in your chart.
Compare to previous periods
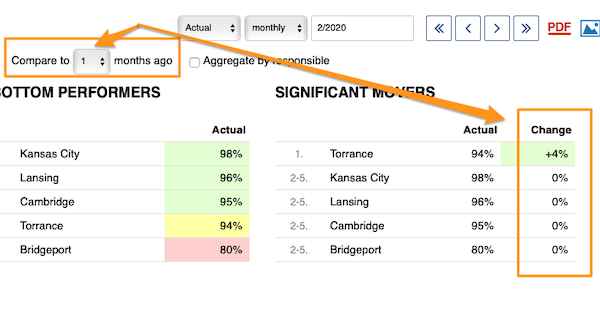
With Compare to, you choose from the submenu how many periods (1–12) to go back to compare the performance with the current period under Significant Movers.
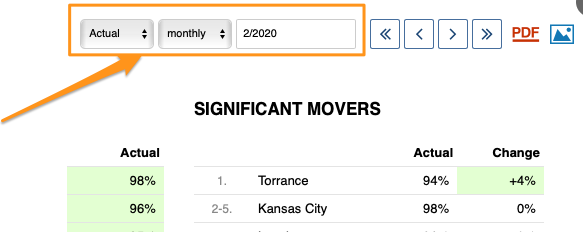
The period is based on your selection.
Show the change in values or percent
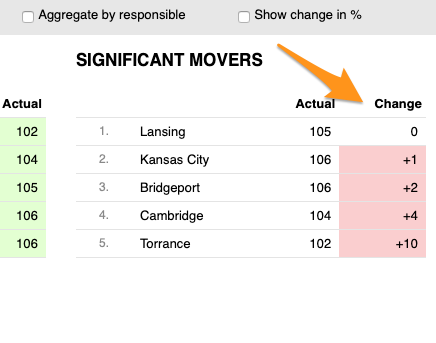
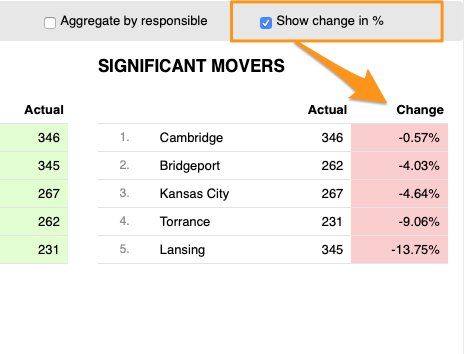
You can display the change in performance compared with another time period either in absolute values or in percent.
Skip weekends
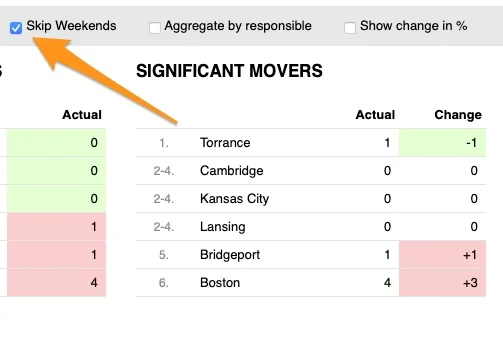
You can also Skip Weekends in the comparison data of your significant movers.
Aggregate by responsible
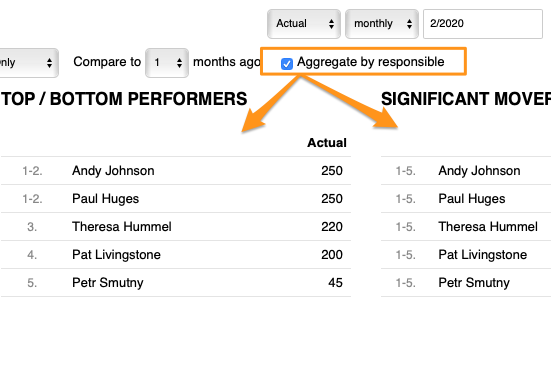
With Aggregate by responsible, you can summarize the data for all org. units or projects in the dashboard per responsible person.
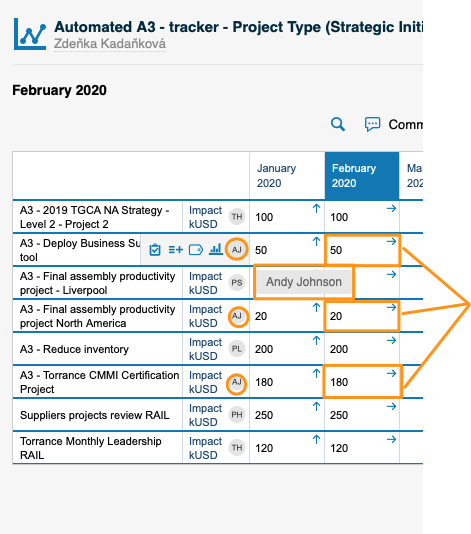
Set up the responsible in the metric dashboard
Use the project leader in automatic dashboards
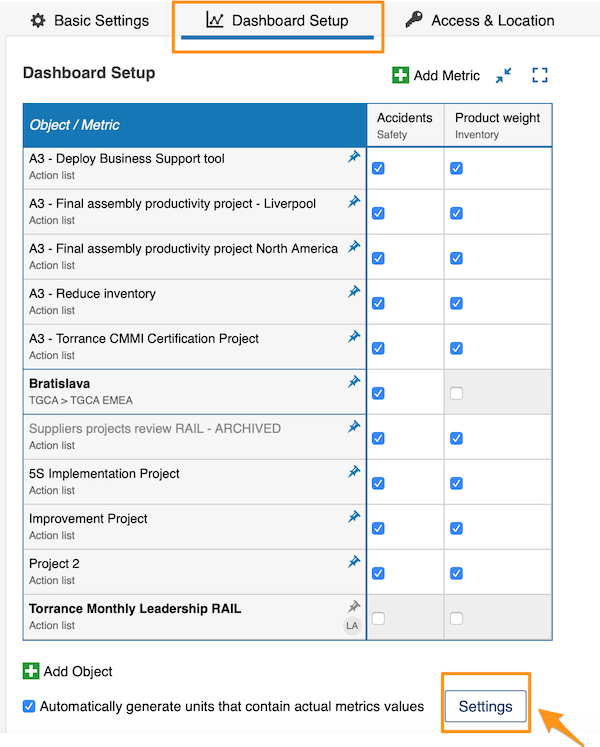
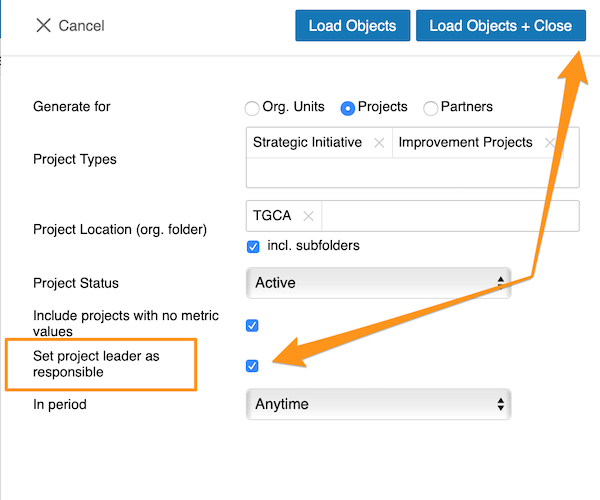
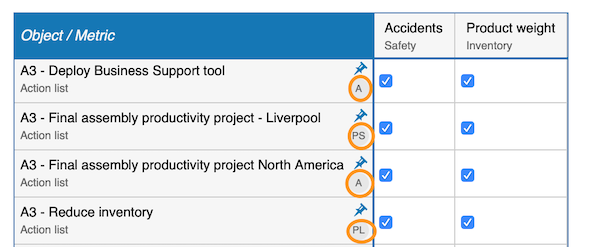
When you use an automatic metric dashboard, click the Settings button at the bottom and tick the Set project leader as responsible box. The responsible is then added to your dashboard automatically.
Choose the responsible per cell
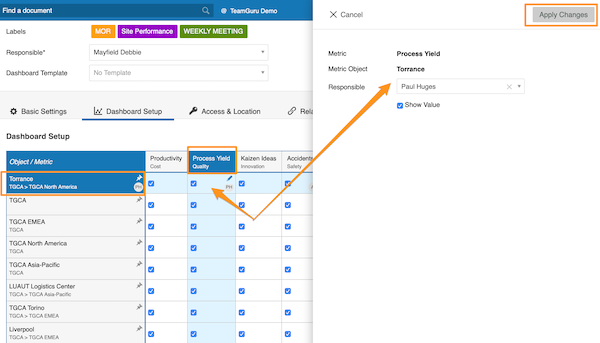
If you do not use an automatic metric dashboard, or you want to choose your responsible manually, go to your dashboard settings and open the Dashboard Setup tab.
There, you can select the responsible for an org. unit and metric combination: click the cell, add your responsible and apply the changes.
Choose the responsible per org. unit
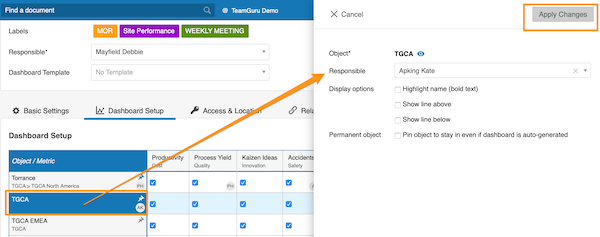
Alternatively, select the responsible for the whole org. unit: click the org. unit, choose the responsible and apply the changes.
See the responsible in the dashboard
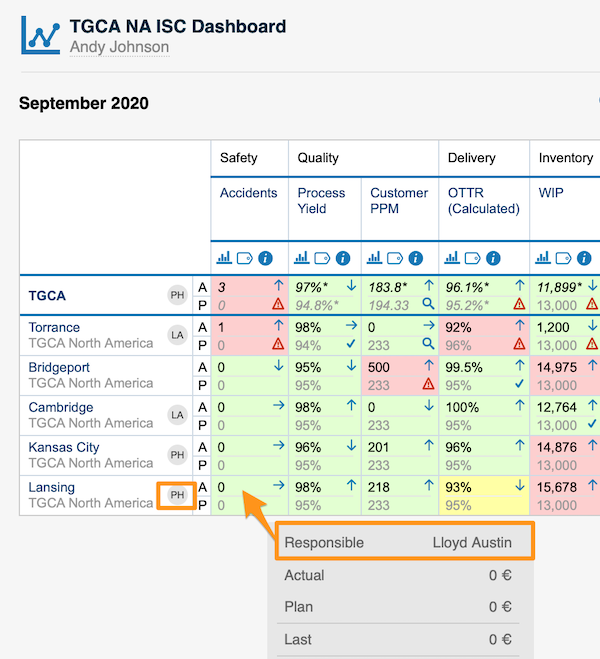
For an org. unit or project, the responsible’s initials are displayed right next to it; when you hover over the initials, you see the full name.
For an org. unit and metric combination, the responsible is shown in a pop-up window along with other data when you hover over the cell.
You can assign only one responsible per project.
Vea las estadísticas de su dashboard de KPI en un gráfico y personalícelo a su gusto.
También puede conocer la función de gráfico de tendencia y vista de gráficos del dashboard de KPI.
Vea el video o siga las instrucciones escritas a continuación.
Ver las estadísticas
-
Abra las estadísticas. Haga clic en el icono de gráfico de columnas para ver las estadísticas del dashboard. Las capturas muestran el icono en distintas vistas del dashboard.
Solo puede ver estadísticas si su dashboard tiene más de una unidad organizativa, proyecto o partner.
-
Lea la vista básica. La vista básica muestra sus unidades base (de entrada), los Mejores/Peores (ordenados de mejor a peor resultado) y los Cambios significativos, con una columna adicional que compara el desempeño con el último período.
-
Abra Más configuración. Haga clic en el botón Más configuración en la esquina superior izquierda para personalizar la vista.
Personalizar las estadísticas
Elegir gráfico de barras o circular
Elija la vista de gráfico de barras o de gráfico circular.
Seleccionar las unidades
Seleccione las unidades que quiere ver en el gráfico.
Comparar con períodos anteriores
Con Comparar con, elija en el submenú cuántos períodos atrás (1–12) quiere ir para comparar el desempeño con el período actual en Cambios significativos.
El período depende de su selección.
Mostrar la variación en valores o en porcentaje
Puede mostrar la variación del desempeño respecto a otro período en valores absolutos o en porcentaje.
Omitir fines de semana
También puede Omitir fines de semana en los datos de comparación de los cambios significativos.
Agrupar por responsable
Con Agrupar por responsable puede resumir los datos de todas las unidades organizativas o proyectos del dashboard por responsable.
Definir el responsable en el dashboard de KPI
Usar el líder del proyecto en dashboards automáticos
Si usa un dashboard de KPI automático, haga clic en el botón Configuración en la parte inferior y marque la casilla Asignar al líder del proyecto como responsable. El responsable se agrega entonces automáticamente al dashboard.
Elegir el responsable por celda
Si no usa un dashboard de KPI automático o quiere elegir el responsable manualmente, vaya a la configuración del dashboard y abra la pestaña Configuración del dashboard.
Ahí puede seleccionar el responsable de una combinación de unidad organizativa y métrica: haga clic en la celda, agregue el responsable y aplique los cambios.
Elegir el responsable por unidad organizativa
También puede seleccionar el responsable de toda la unidad organizativa: haga clic en la unidad organizativa, elija el responsable y aplique los cambios.
Ver el responsable en el dashboard
En una unidad organizativa o un proyecto, las iniciales del responsable aparecen justo al lado; al pasar el cursor sobre ellas, se ve el nombre completo.
En una combinación de unidad organizativa y métrica, el responsable aparece en una ventana emergente junto con otros datos al pasar el cursor sobre la celda.
Solo puede asignar un responsable por proyecto.
¿Necesita más ayuda?
Escríbanos. En días laborables solemos responder en menos de una hora.